Pennsylvania German vs Immigrants from Austria In Labor Force | Age 16-19
COMPARE
Pennsylvania German
Immigrants from Austria
In Labor Force | Age 16-19
In Labor Force | Age 16-19 Comparison
Pennsylvania Germans
Immigrants from Austria
46.4%
IN LABOR FORCE | AGE 16-19
100.0/ 100
METRIC RATING
1st/ 347
METRIC RANK
37.9%
IN LABOR FORCE | AGE 16-19
95.0/ 100
METRIC RATING
131st/ 347
METRIC RANK
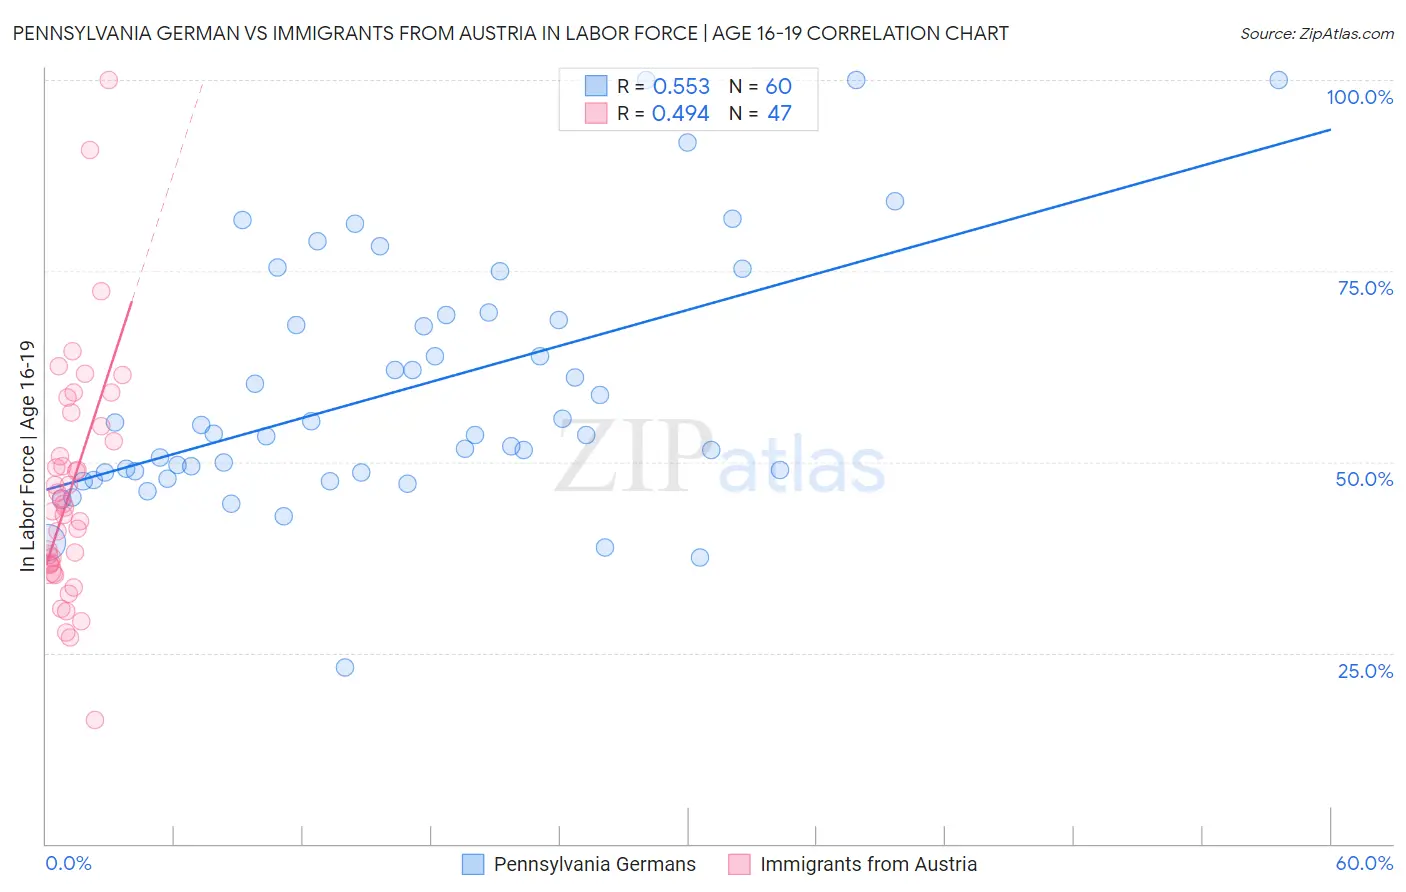
Pennsylvania German vs Immigrants from Austria In Labor Force | Age 16-19 Correlation Chart
The statistical analysis conducted on geographies consisting of 233,701,573 people shows a substantial positive correlation between the proportion of Pennsylvania Germans and labor force participation rate among population between the ages 16 and 19 in the United States with a correlation coefficient (R) of 0.553 and weighted average of 46.4%. Similarly, the statistical analysis conducted on geographies consisting of 167,731,436 people shows a moderate positive correlation between the proportion of Immigrants from Austria and labor force participation rate among population between the ages 16 and 19 in the United States with a correlation coefficient (R) of 0.494 and weighted average of 37.9%, a difference of 22.4%.
In Labor Force | Age 16-19 Correlation Summary
| Measurement | Pennsylvania German | Immigrants from Austria |
| Minimum | 23.1% | 16.2% |
| Maximum | 100.0% | 100.0% |
| Range | 76.9% | 83.8% |
| Mean | 59.4% | 46.4% |
| Median | 53.7% | 44.0% |
| Interquartile 25% (IQ1) | 48.6% | 36.6% |
| Interquartile 75% (IQ3) | 68.9% | 54.7% |
| Interquartile Range (IQR) | 20.3% | 18.1% |
| Standard Deviation (Sample) | 16.4% | 15.5% |
| Standard Deviation (Population) | 16.2% | 15.4% |
Similar Demographics by In Labor Force | Age 16-19
Demographics Similar to Pennsylvania Germans by In Labor Force | Age 16-19
In terms of in labor force | age 16-19, the demographic groups most similar to Pennsylvania Germans are Norwegian (46.2%, a difference of 0.56%), Immigrants from Somalia (45.6%, a difference of 1.9%), Luxembourger (45.3%, a difference of 2.5%), Alaskan Athabascan (45.2%, a difference of 2.7%), and Somali (45.1%, a difference of 2.9%).
| Demographics | Rating | Rank | In Labor Force | Age 16-19 |
| Pennsylvania Germans | 100.0 /100 | #1 | Exceptional 46.4% |
| Norwegians | 100.0 /100 | #2 | Exceptional 46.2% |
| Immigrants | Somalia | 100.0 /100 | #3 | Exceptional 45.6% |
| Luxembourgers | 100.0 /100 | #4 | Exceptional 45.3% |
| Alaskan Athabascans | 100.0 /100 | #5 | Exceptional 45.2% |
| Somalis | 100.0 /100 | #6 | Exceptional 45.1% |
| Danes | 100.0 /100 | #7 | Exceptional 44.7% |
| Immigrants | Cabo Verde | 100.0 /100 | #8 | Exceptional 44.7% |
| Cape Verdeans | 100.0 /100 | #9 | Exceptional 44.5% |
| Germans | 100.0 /100 | #10 | Exceptional 44.2% |
| Swedes | 100.0 /100 | #11 | Exceptional 44.1% |
| Finns | 100.0 /100 | #12 | Exceptional 43.9% |
| Dutch | 100.0 /100 | #13 | Exceptional 43.8% |
| Chippewa | 100.0 /100 | #14 | Exceptional 43.8% |
| Slovenes | 100.0 /100 | #15 | Exceptional 43.7% |
Demographics Similar to Immigrants from Austria by In Labor Force | Age 16-19
In terms of in labor force | age 16-19, the demographic groups most similar to Immigrants from Austria are Immigrants from Oceania (37.9%, a difference of 0.080%), Immigrants from Zimbabwe (38.0%, a difference of 0.090%), Cheyenne (37.9%, a difference of 0.11%), Spaniard (38.0%, a difference of 0.12%), and Choctaw (38.0%, a difference of 0.15%).
| Demographics | Rating | Rank | In Labor Force | Age 16-19 |
| Immigrants | England | 96.4 /100 | #124 | Exceptional 38.1% |
| Immigrants | Africa | 96.1 /100 | #125 | Exceptional 38.0% |
| Africans | 95.6 /100 | #126 | Exceptional 38.0% |
| Choctaw | 95.6 /100 | #127 | Exceptional 38.0% |
| New Zealanders | 95.6 /100 | #128 | Exceptional 38.0% |
| Spaniards | 95.5 /100 | #129 | Exceptional 38.0% |
| Immigrants | Zimbabwe | 95.4 /100 | #130 | Exceptional 38.0% |
| Immigrants | Austria | 95.0 /100 | #131 | Exceptional 37.9% |
| Immigrants | Oceania | 94.7 /100 | #132 | Exceptional 37.9% |
| Cheyenne | 94.6 /100 | #133 | Exceptional 37.9% |
| Immigrants | Netherlands | 93.7 /100 | #134 | Exceptional 37.8% |
| Macedonians | 93.4 /100 | #135 | Exceptional 37.8% |
| Australians | 93.2 /100 | #136 | Exceptional 37.8% |
| Cajuns | 93.2 /100 | #137 | Exceptional 37.8% |
| Comanche | 91.9 /100 | #138 | Exceptional 37.7% |