Immigrants from Guatemala vs Immigrants from Austria In Labor Force | Age 16-19
COMPARE
Immigrants from Guatemala
Immigrants from Austria
In Labor Force | Age 16-19
In Labor Force | Age 16-19 Comparison
Immigrants from Guatemala
Immigrants from Austria
35.3%
IN LABOR FORCE | AGE 16-19
5.7/ 100
METRIC RATING
226th/ 347
METRIC RANK
37.9%
IN LABOR FORCE | AGE 16-19
95.0/ 100
METRIC RATING
131st/ 347
METRIC RANK
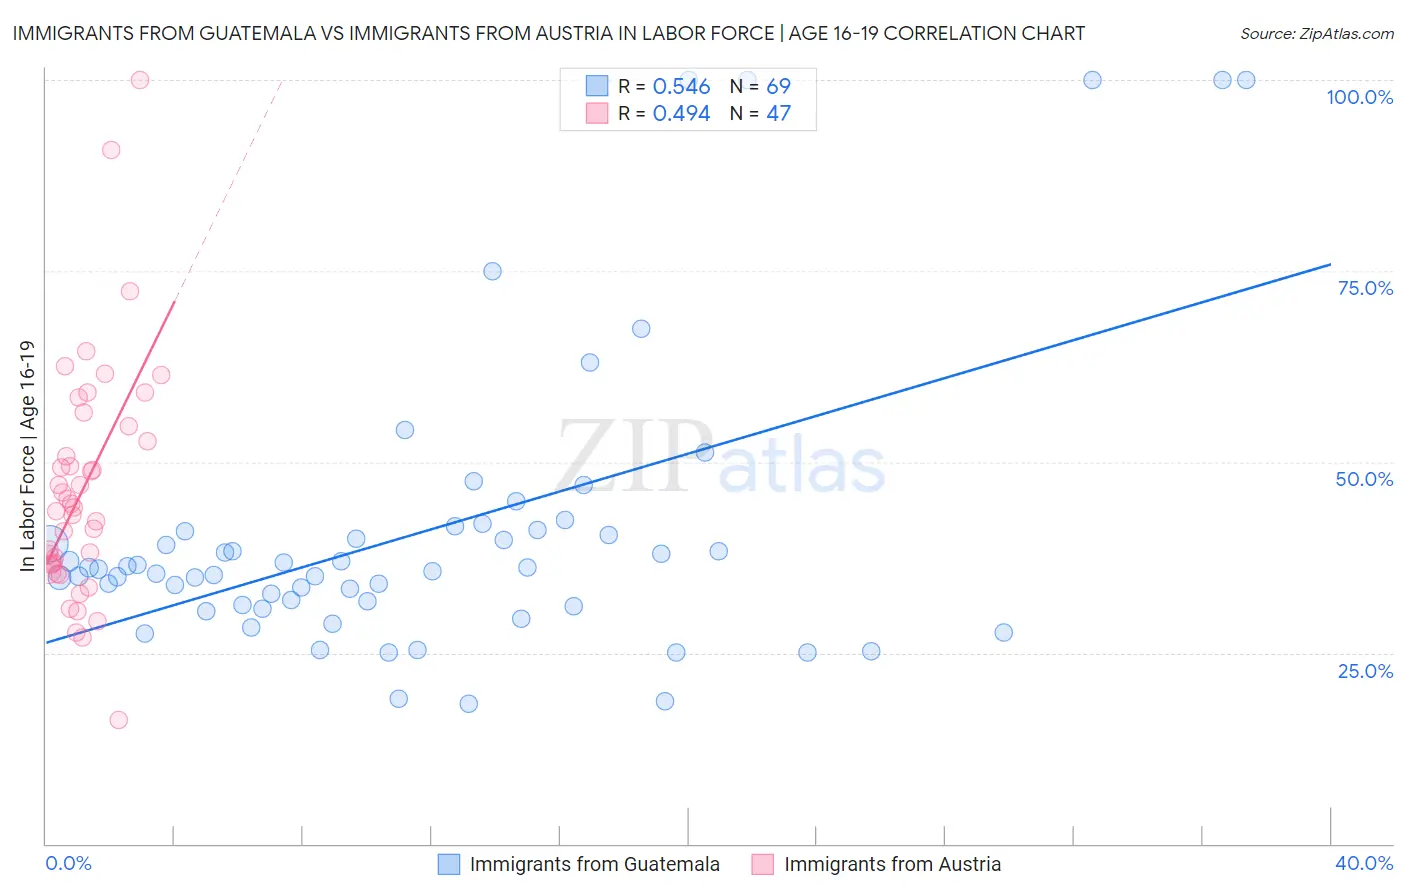
Immigrants from Guatemala vs Immigrants from Austria In Labor Force | Age 16-19 Correlation Chart
The statistical analysis conducted on geographies consisting of 376,894,090 people shows a substantial positive correlation between the proportion of Immigrants from Guatemala and labor force participation rate among population between the ages 16 and 19 in the United States with a correlation coefficient (R) of 0.546 and weighted average of 35.3%. Similarly, the statistical analysis conducted on geographies consisting of 167,731,436 people shows a moderate positive correlation between the proportion of Immigrants from Austria and labor force participation rate among population between the ages 16 and 19 in the United States with a correlation coefficient (R) of 0.494 and weighted average of 37.9%, a difference of 7.5%.
In Labor Force | Age 16-19 Correlation Summary
| Measurement | Immigrants from Guatemala | Immigrants from Austria |
| Minimum | 18.3% | 16.2% |
| Maximum | 100.0% | 100.0% |
| Range | 81.7% | 83.8% |
| Mean | 40.9% | 46.4% |
| Median | 36.0% | 44.0% |
| Interquartile 25% (IQ1) | 31.1% | 36.6% |
| Interquartile 75% (IQ3) | 41.0% | 54.7% |
| Interquartile Range (IQR) | 9.8% | 18.1% |
| Standard Deviation (Sample) | 19.3% | 15.5% |
| Standard Deviation (Population) | 19.2% | 15.4% |
Similar Demographics by In Labor Force | Age 16-19
Demographics Similar to Immigrants from Guatemala by In Labor Force | Age 16-19
In terms of in labor force | age 16-19, the demographic groups most similar to Immigrants from Guatemala are Mongolian (35.3%, a difference of 0.010%), Immigrants from Senegal (35.3%, a difference of 0.060%), Immigrants from Belgium (35.3%, a difference of 0.090%), Honduran (35.3%, a difference of 0.17%), and Ghanaian (35.3%, a difference of 0.19%).
| Demographics | Rating | Rank | In Labor Force | Age 16-19 |
| Guatemalans | 8.6 /100 | #219 | Tragic 35.5% |
| Immigrants | Bahamas | 8.3 /100 | #220 | Tragic 35.5% |
| Turks | 7.3 /100 | #221 | Tragic 35.4% |
| Immigrants | Ghana | 7.3 /100 | #222 | Tragic 35.4% |
| Ghanaians | 6.5 /100 | #223 | Tragic 35.3% |
| Hondurans | 6.5 /100 | #224 | Tragic 35.3% |
| Immigrants | Belgium | 6.1 /100 | #225 | Tragic 35.3% |
| Immigrants | Guatemala | 5.7 /100 | #226 | Tragic 35.3% |
| Mongolians | 5.7 /100 | #227 | Tragic 35.3% |
| Immigrants | Senegal | 5.5 /100 | #228 | Tragic 35.3% |
| Immigrants | Lebanon | 5.0 /100 | #229 | Tragic 35.2% |
| Immigrants | Honduras | 4.9 /100 | #230 | Tragic 35.2% |
| Immigrants | Syria | 4.5 /100 | #231 | Tragic 35.2% |
| Immigrants | Kazakhstan | 4.5 /100 | #232 | Tragic 35.2% |
| Immigrants | France | 4.3 /100 | #233 | Tragic 35.1% |
Demographics Similar to Immigrants from Austria by In Labor Force | Age 16-19
In terms of in labor force | age 16-19, the demographic groups most similar to Immigrants from Austria are Immigrants from Oceania (37.9%, a difference of 0.080%), Immigrants from Zimbabwe (38.0%, a difference of 0.090%), Cheyenne (37.9%, a difference of 0.11%), Spaniard (38.0%, a difference of 0.12%), and Choctaw (38.0%, a difference of 0.15%).
| Demographics | Rating | Rank | In Labor Force | Age 16-19 |
| Immigrants | England | 96.4 /100 | #124 | Exceptional 38.1% |
| Immigrants | Africa | 96.1 /100 | #125 | Exceptional 38.0% |
| Africans | 95.6 /100 | #126 | Exceptional 38.0% |
| Choctaw | 95.6 /100 | #127 | Exceptional 38.0% |
| New Zealanders | 95.6 /100 | #128 | Exceptional 38.0% |
| Spaniards | 95.5 /100 | #129 | Exceptional 38.0% |
| Immigrants | Zimbabwe | 95.4 /100 | #130 | Exceptional 38.0% |
| Immigrants | Austria | 95.0 /100 | #131 | Exceptional 37.9% |
| Immigrants | Oceania | 94.7 /100 | #132 | Exceptional 37.9% |
| Cheyenne | 94.6 /100 | #133 | Exceptional 37.9% |
| Immigrants | Netherlands | 93.7 /100 | #134 | Exceptional 37.8% |
| Macedonians | 93.4 /100 | #135 | Exceptional 37.8% |
| Australians | 93.2 /100 | #136 | Exceptional 37.8% |
| Cajuns | 93.2 /100 | #137 | Exceptional 37.8% |
| Comanche | 91.9 /100 | #138 | Exceptional 37.7% |