Ethiopian vs Yakama In Labor Force | Age 20-64
COMPARE
Ethiopian
Yakama
In Labor Force | Age 20-64
In Labor Force | Age 20-64 Comparison
Ethiopians
Yakama
82.0%
IN LABOR FORCE | AGE 20-64
100.0/ 100
METRIC RATING
2nd/ 347
METRIC RANK
75.8%
IN LABOR FORCE | AGE 20-64
0.0/ 100
METRIC RATING
320th/ 347
METRIC RANK
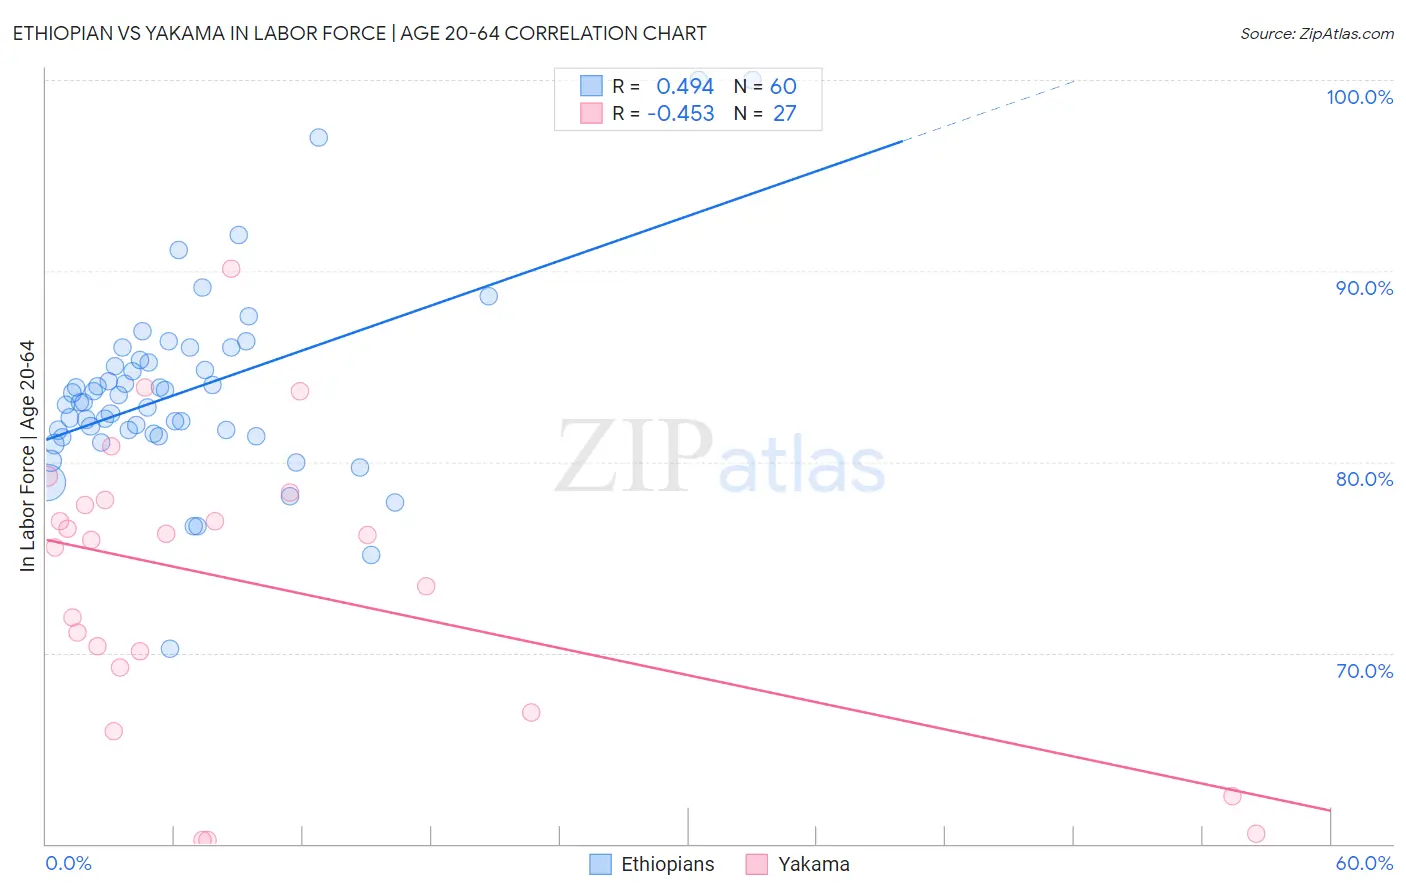
Ethiopian vs Yakama In Labor Force | Age 20-64 Correlation Chart
The statistical analysis conducted on geographies consisting of 223,266,449 people shows a moderate positive correlation between the proportion of Ethiopians and labor force participation rate among population between the ages 20 and 64 in the United States with a correlation coefficient (R) of 0.494 and weighted average of 82.0%. Similarly, the statistical analysis conducted on geographies consisting of 19,917,879 people shows a moderate negative correlation between the proportion of Yakama and labor force participation rate among population between the ages 20 and 64 in the United States with a correlation coefficient (R) of -0.453 and weighted average of 75.8%, a difference of 8.2%.
In Labor Force | Age 20-64 Correlation Summary
| Measurement | Ethiopian | Yakama |
| Minimum | 70.2% | 60.2% |
| Maximum | 100.0% | 90.1% |
| Range | 29.8% | 29.9% |
| Mean | 83.7% | 73.6% |
| Median | 83.1% | 75.9% |
| Interquartile 25% (IQ1) | 81.4% | 69.2% |
| Interquartile 75% (IQ3) | 85.3% | 78.0% |
| Interquartile Range (IQR) | 3.9% | 8.8% |
| Standard Deviation (Sample) | 5.1% | 7.6% |
| Standard Deviation (Population) | 5.0% | 7.4% |
Similar Demographics by In Labor Force | Age 20-64
Demographics Similar to Ethiopians by In Labor Force | Age 20-64
In terms of in labor force | age 20-64, the demographic groups most similar to Ethiopians are Immigrants from Bolivia (81.9%, a difference of 0.020%), Immigrants from Ethiopia (82.1%, a difference of 0.12%), Luxembourger (81.9%, a difference of 0.13%), Bolivian (81.7%, a difference of 0.33%), and Somali (81.6%, a difference of 0.44%).
| Demographics | Rating | Rank | In Labor Force | Age 20-64 |
| Immigrants | Ethiopia | 100.0 /100 | #1 | Exceptional 82.1% |
| Ethiopians | 100.0 /100 | #2 | Exceptional 82.0% |
| Immigrants | Bolivia | 100.0 /100 | #3 | Exceptional 81.9% |
| Luxembourgers | 100.0 /100 | #4 | Exceptional 81.9% |
| Bolivians | 100.0 /100 | #5 | Exceptional 81.7% |
| Somalis | 100.0 /100 | #6 | Exceptional 81.6% |
| Immigrants | Cameroon | 100.0 /100 | #7 | Exceptional 81.6% |
| Immigrants | Somalia | 100.0 /100 | #8 | Exceptional 81.6% |
| Sierra Leoneans | 100.0 /100 | #9 | Exceptional 81.5% |
| Immigrants | Sierra Leone | 100.0 /100 | #10 | Exceptional 81.5% |
| Immigrants | Eastern Africa | 100.0 /100 | #11 | Exceptional 81.3% |
| Immigrants | Eritrea | 100.0 /100 | #12 | Exceptional 81.3% |
| Immigrants | India | 100.0 /100 | #13 | Exceptional 81.3% |
| Cambodians | 100.0 /100 | #14 | Exceptional 81.1% |
| Bulgarians | 100.0 /100 | #15 | Exceptional 81.1% |
Demographics Similar to Yakama by In Labor Force | Age 20-64
In terms of in labor force | age 20-64, the demographic groups most similar to Yakama are Seminole (75.5%, a difference of 0.35%), Inupiat (76.1%, a difference of 0.38%), Dutch West Indian (75.5%, a difference of 0.40%), Cajun (75.5%, a difference of 0.44%), and Choctaw (75.4%, a difference of 0.50%).
| Demographics | Rating | Rank | In Labor Force | Age 20-64 |
| Shoshone | 0.0 /100 | #313 | Tragic 76.8% |
| Blacks/African Americans | 0.0 /100 | #314 | Tragic 76.8% |
| Ottawa | 0.0 /100 | #315 | Tragic 76.7% |
| Yaqui | 0.0 /100 | #316 | Tragic 76.5% |
| Cherokee | 0.0 /100 | #317 | Tragic 76.2% |
| Chickasaw | 0.0 /100 | #318 | Tragic 76.2% |
| Inupiat | 0.0 /100 | #319 | Tragic 76.1% |
| Yakama | 0.0 /100 | #320 | Tragic 75.8% |
| Seminole | 0.0 /100 | #321 | Tragic 75.5% |
| Dutch West Indians | 0.0 /100 | #322 | Tragic 75.5% |
| Cajuns | 0.0 /100 | #323 | Tragic 75.5% |
| Choctaw | 0.0 /100 | #324 | Tragic 75.4% |
| Menominee | 0.0 /100 | #325 | Tragic 75.3% |
| Creek | 0.0 /100 | #326 | Tragic 75.1% |
| Sioux | 0.0 /100 | #327 | Tragic 75.0% |