Ethiopian vs Yakama No Vehicles in Household
COMPARE
Ethiopian
Yakama
No Vehicles in Household
No Vehicles in Household Comparison
Ethiopians
Yakama
10.5%
NO VEHICLES IN HOUSEHOLD
45.8/ 100
METRIC RATING
179th/ 347
METRIC RANK
6.6%
NO VEHICLES IN HOUSEHOLD
100.0/ 100
METRIC RATING
5th/ 347
METRIC RANK
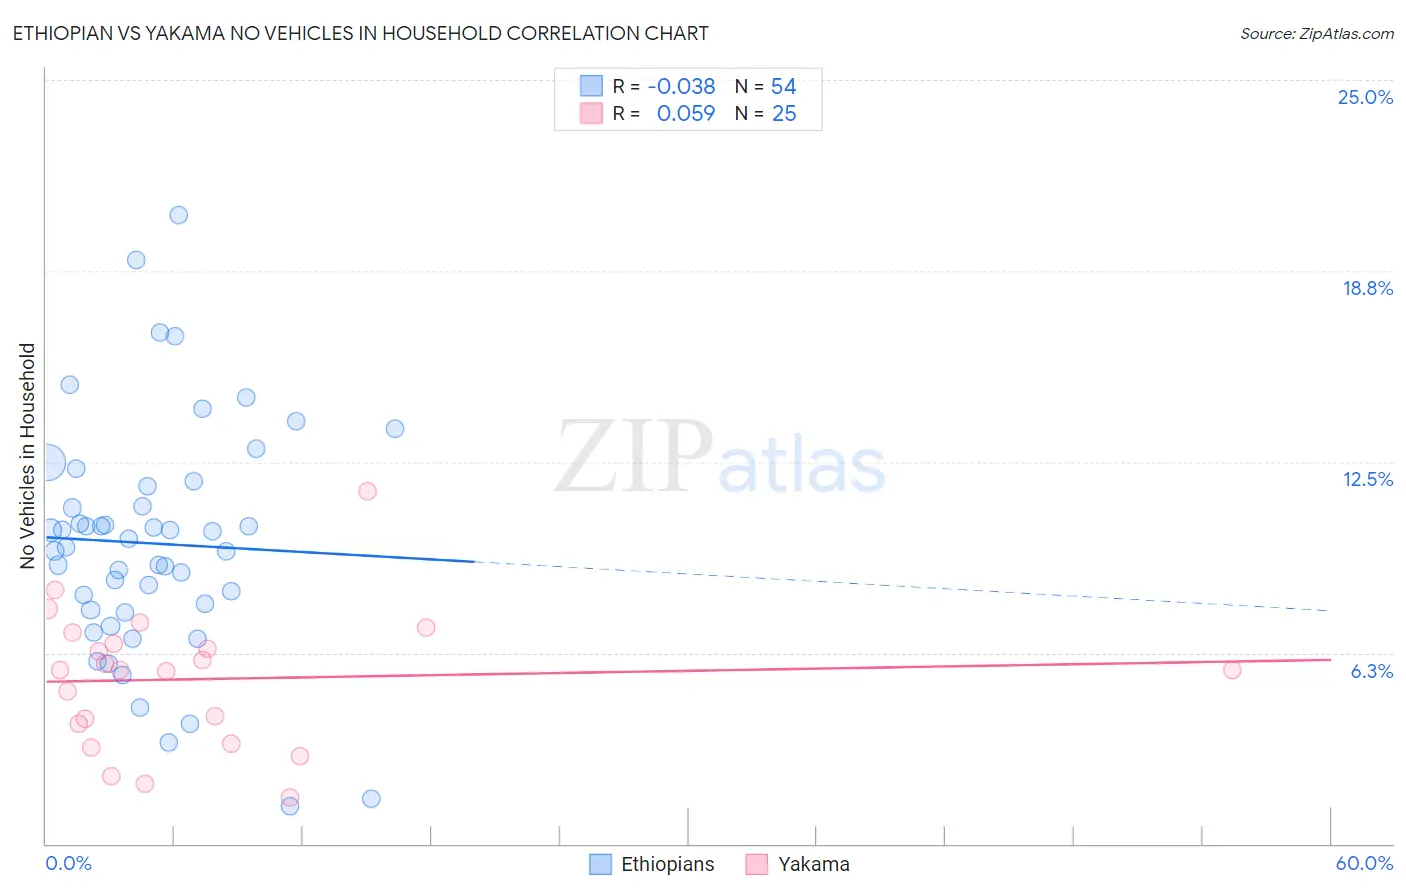
Ethiopian vs Yakama No Vehicles in Household Correlation Chart
The statistical analysis conducted on geographies consisting of 222,936,450 people shows no correlation between the proportion of Ethiopians and percentage of households with no vehicle available in the United States with a correlation coefficient (R) of -0.038 and weighted average of 10.5%. Similarly, the statistical analysis conducted on geographies consisting of 19,905,065 people shows a slight positive correlation between the proportion of Yakama and percentage of households with no vehicle available in the United States with a correlation coefficient (R) of 0.059 and weighted average of 6.6%, a difference of 58.3%.
No Vehicles in Household Correlation Summary
| Measurement | Ethiopian | Yakama |
| Minimum | 1.2% | 1.5% |
| Maximum | 20.6% | 11.5% |
| Range | 19.4% | 10.0% |
| Mean | 9.8% | 5.4% |
| Median | 9.8% | 5.7% |
| Interquartile 25% (IQ1) | 7.6% | 3.6% |
| Interquartile 75% (IQ3) | 11.7% | 6.7% |
| Interquartile Range (IQR) | 4.1% | 3.1% |
| Standard Deviation (Sample) | 3.9% | 2.3% |
| Standard Deviation (Population) | 3.8% | 2.2% |
Similar Demographics by No Vehicles in Household
Demographics Similar to Ethiopians by No Vehicles in Household
In terms of no vehicles in household, the demographic groups most similar to Ethiopians are Arab (10.5%, a difference of 0.060%), Immigrants from Colombia (10.5%, a difference of 0.22%), Immigrants from Bulgaria (10.5%, a difference of 0.26%), Native/Alaskan (10.5%, a difference of 0.28%), and Immigrants from Ethiopia (10.4%, a difference of 0.30%).
| Demographics | Rating | Rank | No Vehicles in Household |
| Brazilians | 51.7 /100 | #172 | Average 10.4% |
| Filipinos | 50.1 /100 | #173 | Average 10.4% |
| Immigrants | Sudan | 50.0 /100 | #174 | Average 10.4% |
| Immigrants | Burma/Myanmar | 49.1 /100 | #175 | Average 10.4% |
| French American Indians | 49.1 /100 | #176 | Average 10.4% |
| Immigrants | El Salvador | 49.1 /100 | #177 | Average 10.4% |
| Immigrants | Ethiopia | 48.0 /100 | #178 | Average 10.4% |
| Ethiopians | 45.8 /100 | #179 | Average 10.5% |
| Arabs | 45.3 /100 | #180 | Average 10.5% |
| Immigrants | Colombia | 44.1 /100 | #181 | Average 10.5% |
| Immigrants | Bulgaria | 43.8 /100 | #182 | Average 10.5% |
| Natives/Alaskans | 43.7 /100 | #183 | Average 10.5% |
| Immigrants | Nepal | 42.4 /100 | #184 | Average 10.5% |
| South Americans | 41.9 /100 | #185 | Average 10.5% |
| German Russians | 40.6 /100 | #186 | Average 10.5% |
Demographics Similar to Yakama by No Vehicles in Household
In terms of no vehicles in household, the demographic groups most similar to Yakama are Danish (6.6%, a difference of 0.35%), German (6.7%, a difference of 0.99%), English (6.5%, a difference of 1.6%), Scottish (6.8%, a difference of 2.3%), and Norwegian (6.4%, a difference of 2.7%).
| Demographics | Rating | Rank | No Vehicles in Household |
| Luxembourgers | 100.0 /100 | #1 | Exceptional 5.4% |
| Norwegians | 100.0 /100 | #2 | Exceptional 6.4% |
| English | 100.0 /100 | #3 | Exceptional 6.5% |
| Danes | 100.0 /100 | #4 | Exceptional 6.6% |
| Yakama | 100.0 /100 | #5 | Exceptional 6.6% |
| Germans | 100.0 /100 | #6 | Exceptional 6.7% |
| Scottish | 100.0 /100 | #7 | Exceptional 6.8% |
| Swedes | 100.0 /100 | #8 | Exceptional 6.8% |
| Scotch-Irish | 100.0 /100 | #9 | Exceptional 6.8% |
| Dutch | 100.0 /100 | #10 | Exceptional 6.8% |
| Czechs | 100.0 /100 | #11 | Exceptional 6.9% |
| Assyrians/Chaldeans/Syriacs | 100.0 /100 | #12 | Exceptional 7.0% |
| Scandinavians | 100.0 /100 | #13 | Exceptional 7.0% |
| Mexicans | 100.0 /100 | #14 | Exceptional 7.0% |
| Whites/Caucasians | 100.0 /100 | #15 | Exceptional 7.0% |