Korean vs Yakama In Labor Force | Age 20-64
COMPARE
Korean
Yakama
In Labor Force | Age 20-64
In Labor Force | Age 20-64 Comparison
Koreans
Yakama
79.8%
IN LABOR FORCE | AGE 20-64
79.6/ 100
METRIC RATING
144th/ 347
METRIC RANK
75.8%
IN LABOR FORCE | AGE 20-64
0.0/ 100
METRIC RATING
320th/ 347
METRIC RANK
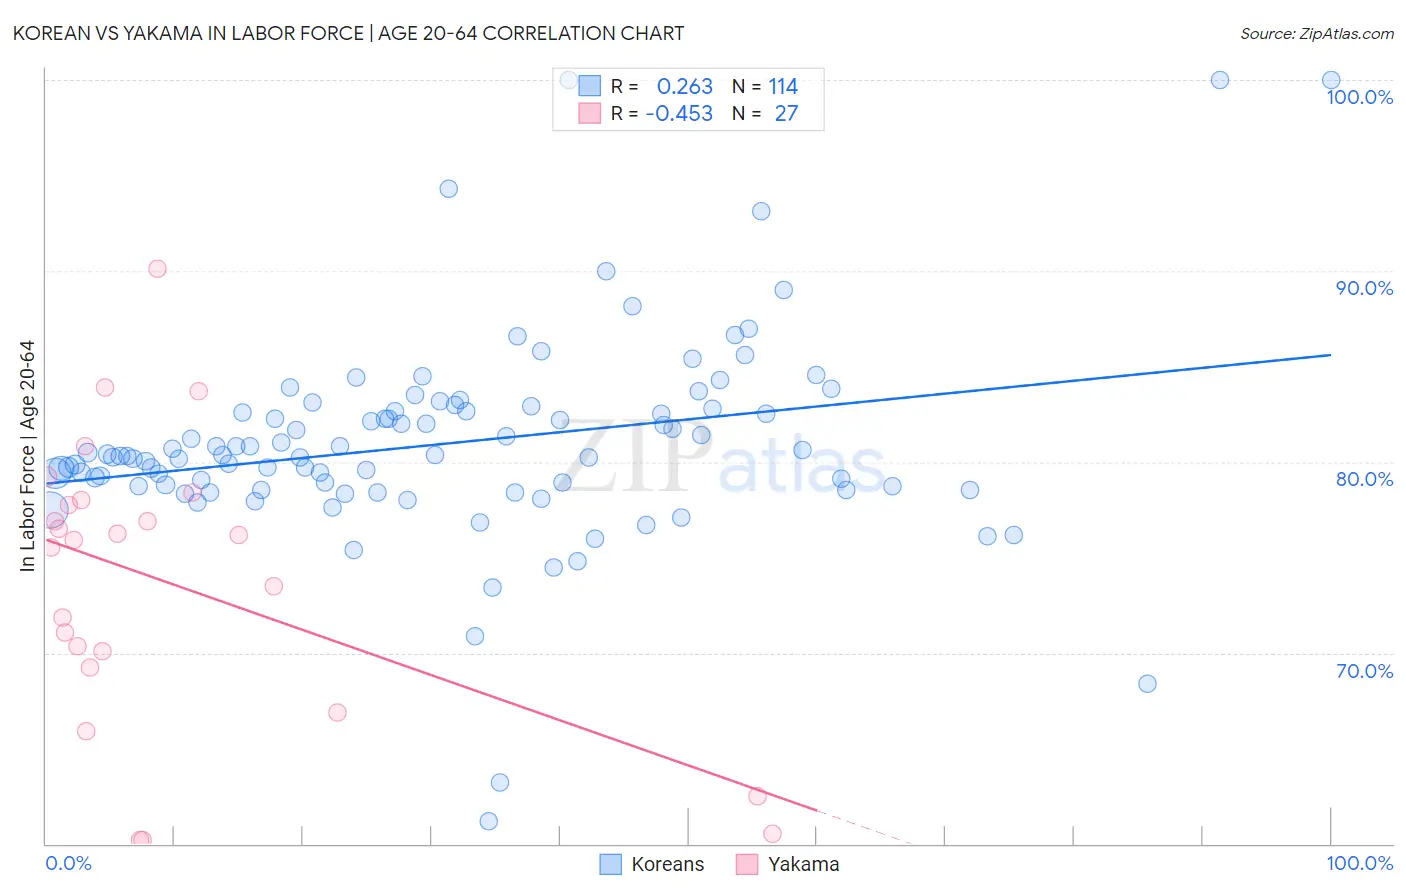
Korean vs Yakama In Labor Force | Age 20-64 Correlation Chart
The statistical analysis conducted on geographies consisting of 510,967,467 people shows a weak positive correlation between the proportion of Koreans and labor force participation rate among population between the ages 20 and 64 in the United States with a correlation coefficient (R) of 0.263 and weighted average of 79.8%. Similarly, the statistical analysis conducted on geographies consisting of 19,917,879 people shows a moderate negative correlation between the proportion of Yakama and labor force participation rate among population between the ages 20 and 64 in the United States with a correlation coefficient (R) of -0.453 and weighted average of 75.8%, a difference of 5.3%.
In Labor Force | Age 20-64 Correlation Summary
| Measurement | Korean | Yakama |
| Minimum | 61.2% | 60.2% |
| Maximum | 100.0% | 90.1% |
| Range | 38.8% | 29.9% |
| Mean | 81.0% | 73.6% |
| Median | 80.3% | 75.9% |
| Interquartile 25% (IQ1) | 78.7% | 69.2% |
| Interquartile 75% (IQ3) | 82.7% | 78.0% |
| Interquartile Range (IQR) | 4.0% | 8.8% |
| Standard Deviation (Sample) | 5.4% | 7.6% |
| Standard Deviation (Population) | 5.4% | 7.4% |
Similar Demographics by In Labor Force | Age 20-64
Demographics Similar to Koreans by In Labor Force | Age 20-64
In terms of in labor force | age 20-64, the demographic groups most similar to Koreans are Immigrants from Israel (79.8%, a difference of 0.0%), Slovak (79.8%, a difference of 0.0%), Immigrants from Sweden (79.8%, a difference of 0.0%), Pakistani (79.8%, a difference of 0.0%), and Immigrants from South Eastern Asia (79.8%, a difference of 0.010%).
| Demographics | Rating | Rank | In Labor Force | Age 20-64 |
| Immigrants | Ukraine | 86.5 /100 | #137 | Excellent 79.9% |
| Immigrants | Nigeria | 86.4 /100 | #138 | Excellent 79.9% |
| Immigrants | Spain | 83.9 /100 | #139 | Excellent 79.8% |
| Immigrants | South Eastern Asia | 80.4 /100 | #140 | Excellent 79.8% |
| Immigrants | Israel | 80.0 /100 | #141 | Good 79.8% |
| Slovaks | 79.9 /100 | #142 | Good 79.8% |
| Immigrants | Sweden | 79.7 /100 | #143 | Good 79.8% |
| Koreans | 79.6 /100 | #144 | Good 79.8% |
| Pakistanis | 79.3 /100 | #145 | Good 79.8% |
| Immigrants | Southern Europe | 78.9 /100 | #146 | Good 79.8% |
| Immigrants | Philippines | 78.0 /100 | #147 | Good 79.8% |
| Romanians | 77.6 /100 | #148 | Good 79.8% |
| Icelanders | 75.1 /100 | #149 | Good 79.7% |
| Costa Ricans | 72.4 /100 | #150 | Good 79.7% |
| Scandinavians | 72.0 /100 | #151 | Good 79.7% |
Demographics Similar to Yakama by In Labor Force | Age 20-64
In terms of in labor force | age 20-64, the demographic groups most similar to Yakama are Seminole (75.5%, a difference of 0.35%), Inupiat (76.1%, a difference of 0.38%), Dutch West Indian (75.5%, a difference of 0.40%), Cajun (75.5%, a difference of 0.44%), and Choctaw (75.4%, a difference of 0.50%).
| Demographics | Rating | Rank | In Labor Force | Age 20-64 |
| Shoshone | 0.0 /100 | #313 | Tragic 76.8% |
| Blacks/African Americans | 0.0 /100 | #314 | Tragic 76.8% |
| Ottawa | 0.0 /100 | #315 | Tragic 76.7% |
| Yaqui | 0.0 /100 | #316 | Tragic 76.5% |
| Cherokee | 0.0 /100 | #317 | Tragic 76.2% |
| Chickasaw | 0.0 /100 | #318 | Tragic 76.2% |
| Inupiat | 0.0 /100 | #319 | Tragic 76.1% |
| Yakama | 0.0 /100 | #320 | Tragic 75.8% |
| Seminole | 0.0 /100 | #321 | Tragic 75.5% |
| Dutch West Indians | 0.0 /100 | #322 | Tragic 75.5% |
| Cajuns | 0.0 /100 | #323 | Tragic 75.5% |
| Choctaw | 0.0 /100 | #324 | Tragic 75.4% |
| Menominee | 0.0 /100 | #325 | Tragic 75.3% |
| Creek | 0.0 /100 | #326 | Tragic 75.1% |
| Sioux | 0.0 /100 | #327 | Tragic 75.0% |