Inupiat vs Yakama In Labor Force | Age 20-64
COMPARE
Inupiat
Yakama
In Labor Force | Age 20-64
In Labor Force | Age 20-64 Comparison
Inupiat
Yakama
76.1%
IN LABOR FORCE | AGE 20-64
0.0/ 100
METRIC RATING
319th/ 347
METRIC RANK
75.8%
IN LABOR FORCE | AGE 20-64
0.0/ 100
METRIC RATING
320th/ 347
METRIC RANK
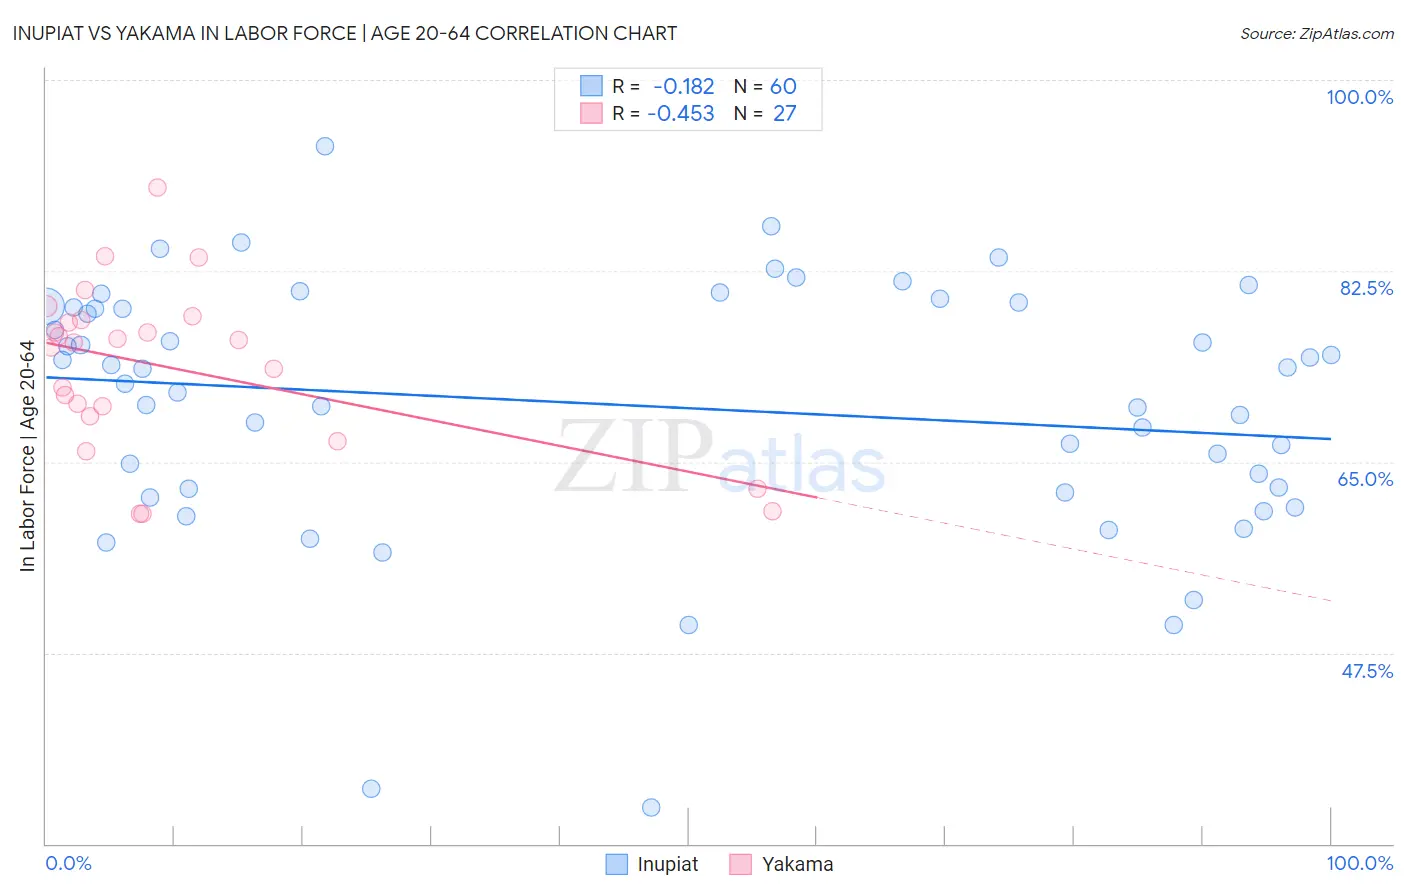
Inupiat vs Yakama In Labor Force | Age 20-64 Correlation Chart
The statistical analysis conducted on geographies consisting of 96,348,375 people shows a poor negative correlation between the proportion of Inupiat and labor force participation rate among population between the ages 20 and 64 in the United States with a correlation coefficient (R) of -0.182 and weighted average of 76.1%. Similarly, the statistical analysis conducted on geographies consisting of 19,917,879 people shows a moderate negative correlation between the proportion of Yakama and labor force participation rate among population between the ages 20 and 64 in the United States with a correlation coefficient (R) of -0.453 and weighted average of 75.8%, a difference of 0.38%.
In Labor Force | Age 20-64 Correlation Summary
| Measurement | Inupiat | Yakama |
| Minimum | 33.3% | 60.2% |
| Maximum | 93.9% | 90.1% |
| Range | 60.6% | 29.9% |
| Mean | 70.2% | 73.6% |
| Median | 72.8% | 75.9% |
| Interquartile 25% (IQ1) | 62.4% | 69.2% |
| Interquartile 75% (IQ3) | 79.2% | 78.0% |
| Interquartile Range (IQR) | 16.9% | 8.8% |
| Standard Deviation (Sample) | 11.9% | 7.6% |
| Standard Deviation (Population) | 11.8% | 7.4% |
Demographics Similar to Inupiat and Yakama by In Labor Force | Age 20-64
In terms of in labor force | age 20-64, the demographic groups most similar to Inupiat are Chickasaw (76.2%, a difference of 0.16%), Cherokee (76.2%, a difference of 0.21%), Yaqui (76.5%, a difference of 0.61%), Seminole (75.5%, a difference of 0.74%), and Dutch West Indian (75.5%, a difference of 0.78%). Similarly, the demographic groups most similar to Yakama are Seminole (75.5%, a difference of 0.35%), Dutch West Indian (75.5%, a difference of 0.40%), Cajun (75.5%, a difference of 0.44%), Choctaw (75.4%, a difference of 0.50%), and Chickasaw (76.2%, a difference of 0.55%).
| Demographics | Rating | Rank | In Labor Force | Age 20-64 |
| Americans | 0.0 /100 | #309 | Tragic 77.0% |
| Comanche | 0.0 /100 | #310 | Tragic 77.0% |
| Blackfeet | 0.0 /100 | #311 | Tragic 77.0% |
| Alaskan Athabascans | 0.0 /100 | #312 | Tragic 76.9% |
| Shoshone | 0.0 /100 | #313 | Tragic 76.8% |
| Blacks/African Americans | 0.0 /100 | #314 | Tragic 76.8% |
| Ottawa | 0.0 /100 | #315 | Tragic 76.7% |
| Yaqui | 0.0 /100 | #316 | Tragic 76.5% |
| Cherokee | 0.0 /100 | #317 | Tragic 76.2% |
| Chickasaw | 0.0 /100 | #318 | Tragic 76.2% |
| Inupiat | 0.0 /100 | #319 | Tragic 76.1% |
| Yakama | 0.0 /100 | #320 | Tragic 75.8% |
| Seminole | 0.0 /100 | #321 | Tragic 75.5% |
| Dutch West Indians | 0.0 /100 | #322 | Tragic 75.5% |
| Cajuns | 0.0 /100 | #323 | Tragic 75.5% |
| Choctaw | 0.0 /100 | #324 | Tragic 75.4% |
| Menominee | 0.0 /100 | #325 | Tragic 75.3% |
| Creek | 0.0 /100 | #326 | Tragic 75.1% |
| Sioux | 0.0 /100 | #327 | Tragic 75.0% |
| Kiowa | 0.0 /100 | #328 | Tragic 75.0% |
| Cheyenne | 0.0 /100 | #329 | Tragic 74.8% |