Ethiopian vs Immigrants from Western Europe In Labor Force | Age 16-19
COMPARE
Ethiopian
Immigrants from Western Europe
In Labor Force | Age 16-19
In Labor Force | Age 16-19 Comparison
Ethiopians
Immigrants from Western Europe
38.2%
IN LABOR FORCE | AGE 16-19
97.4/ 100
METRIC RATING
121st/ 347
METRIC RANK
37.5%
IN LABOR FORCE | AGE 16-19
88.9/ 100
METRIC RATING
146th/ 347
METRIC RANK
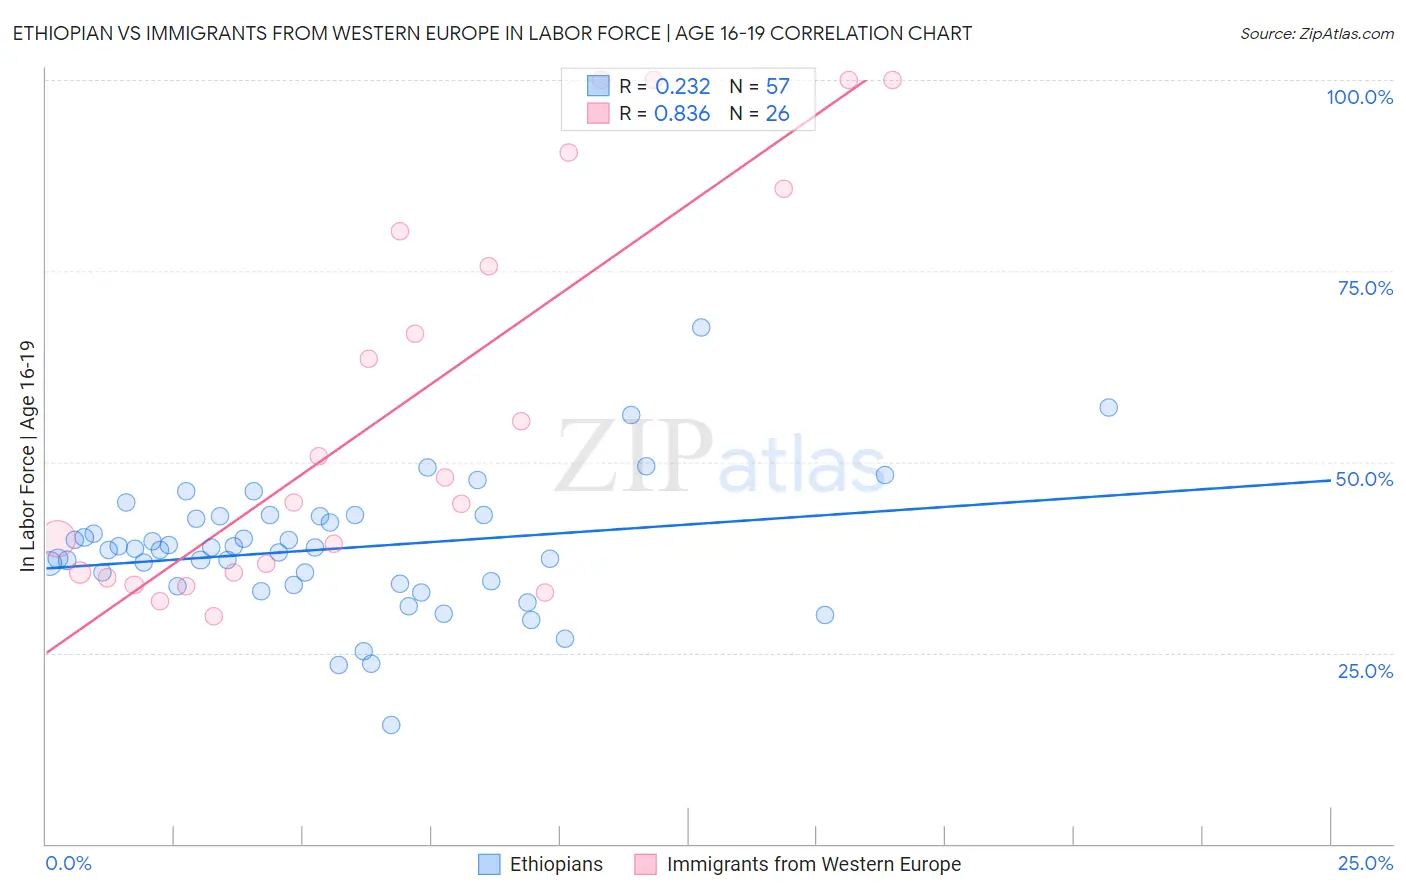
Ethiopian vs Immigrants from Western Europe In Labor Force | Age 16-19 Correlation Chart
The statistical analysis conducted on geographies consisting of 223,172,424 people shows a weak positive correlation between the proportion of Ethiopians and labor force participation rate among population between the ages 16 and 19 in the United States with a correlation coefficient (R) of 0.232 and weighted average of 38.2%. Similarly, the statistical analysis conducted on geographies consisting of 492,395,193 people shows a very strong positive correlation between the proportion of Immigrants from Western Europe and labor force participation rate among population between the ages 16 and 19 in the United States with a correlation coefficient (R) of 0.836 and weighted average of 37.5%, a difference of 1.9%.
In Labor Force | Age 16-19 Correlation Summary
| Measurement | Ethiopian | Immigrants from Western Europe |
| Minimum | 15.6% | 29.8% |
| Maximum | 67.6% | 100.0% |
| Range | 52.0% | 70.2% |
| Mean | 38.6% | 57.3% |
| Median | 38.6% | 46.3% |
| Interquartile 25% (IQ1) | 34.0% | 35.5% |
| Interquartile 75% (IQ3) | 42.8% | 80.2% |
| Interquartile Range (IQR) | 8.9% | 44.7% |
| Standard Deviation (Sample) | 8.5% | 25.5% |
| Standard Deviation (Population) | 8.4% | 25.0% |
Similar Demographics by In Labor Force | Age 16-19
Demographics Similar to Ethiopians by In Labor Force | Age 16-19
In terms of in labor force | age 16-19, the demographic groups most similar to Ethiopians are Guamanian/Chamorro (38.2%, a difference of 0.030%), Ukrainian (38.3%, a difference of 0.11%), Assyrian/Chaldean/Syriac (38.3%, a difference of 0.19%), Immigrants from Nepal (38.3%, a difference of 0.21%), and Chickasaw (38.3%, a difference of 0.22%).
| Demographics | Rating | Rank | In Labor Force | Age 16-19 |
| Hawaiians | 98.2 /100 | #114 | Exceptional 38.4% |
| Bulgarians | 97.9 /100 | #115 | Exceptional 38.3% |
| Colville | 97.9 /100 | #116 | Exceptional 38.3% |
| Chickasaw | 97.8 /100 | #117 | Exceptional 38.3% |
| Immigrants | Nepal | 97.8 /100 | #118 | Exceptional 38.3% |
| Assyrians/Chaldeans/Syriacs | 97.8 /100 | #119 | Exceptional 38.3% |
| Ukrainians | 97.6 /100 | #120 | Exceptional 38.3% |
| Ethiopians | 97.4 /100 | #121 | Exceptional 38.2% |
| Guamanians/Chamorros | 97.4 /100 | #122 | Exceptional 38.2% |
| Seminole | 96.7 /100 | #123 | Exceptional 38.1% |
| Immigrants | England | 96.4 /100 | #124 | Exceptional 38.1% |
| Immigrants | Africa | 96.1 /100 | #125 | Exceptional 38.0% |
| Africans | 95.6 /100 | #126 | Exceptional 38.0% |
| Choctaw | 95.6 /100 | #127 | Exceptional 38.0% |
| New Zealanders | 95.6 /100 | #128 | Exceptional 38.0% |
Demographics Similar to Immigrants from Western Europe by In Labor Force | Age 16-19
In terms of in labor force | age 16-19, the demographic groups most similar to Immigrants from Western Europe are Brazilian (37.5%, a difference of 0.030%), Japanese (37.5%, a difference of 0.050%), Paiute (37.5%, a difference of 0.050%), Pakistani (37.6%, a difference of 0.070%), and Sierra Leonean (37.6%, a difference of 0.10%).
| Demographics | Rating | Rank | In Labor Force | Age 16-19 |
| Immigrants | Moldova | 91.9 /100 | #139 | Exceptional 37.7% |
| Estonians | 91.7 /100 | #140 | Exceptional 37.7% |
| Syrians | 90.7 /100 | #141 | Exceptional 37.6% |
| Sierra Leoneans | 89.7 /100 | #142 | Excellent 37.6% |
| Pakistanis | 89.5 /100 | #143 | Excellent 37.6% |
| Japanese | 89.3 /100 | #144 | Excellent 37.5% |
| Paiute | 89.3 /100 | #145 | Excellent 37.5% |
| Immigrants | Western Europe | 88.9 /100 | #146 | Excellent 37.5% |
| Brazilians | 88.7 /100 | #147 | Excellent 37.5% |
| Romanians | 87.3 /100 | #148 | Excellent 37.5% |
| Native Hawaiians | 85.0 /100 | #149 | Excellent 37.4% |
| Tsimshian | 84.7 /100 | #150 | Excellent 37.4% |
| Immigrants | Poland | 84.4 /100 | #151 | Excellent 37.3% |
| Immigrants | Sierra Leone | 83.6 /100 | #152 | Excellent 37.3% |
| Arapaho | 81.8 /100 | #153 | Excellent 37.3% |