European vs Slavic In Labor Force | Age 25-29
COMPARE
European
Slavic
In Labor Force | Age 25-29
In Labor Force | Age 25-29 Comparison
Europeans
Slavs
84.6%
IN LABOR FORCE | AGE 25-29
40.3/ 100
METRIC RATING
182nd/ 347
METRIC RANK
85.1%
IN LABOR FORCE | AGE 25-29
93.7/ 100
METRIC RATING
102nd/ 347
METRIC RANK
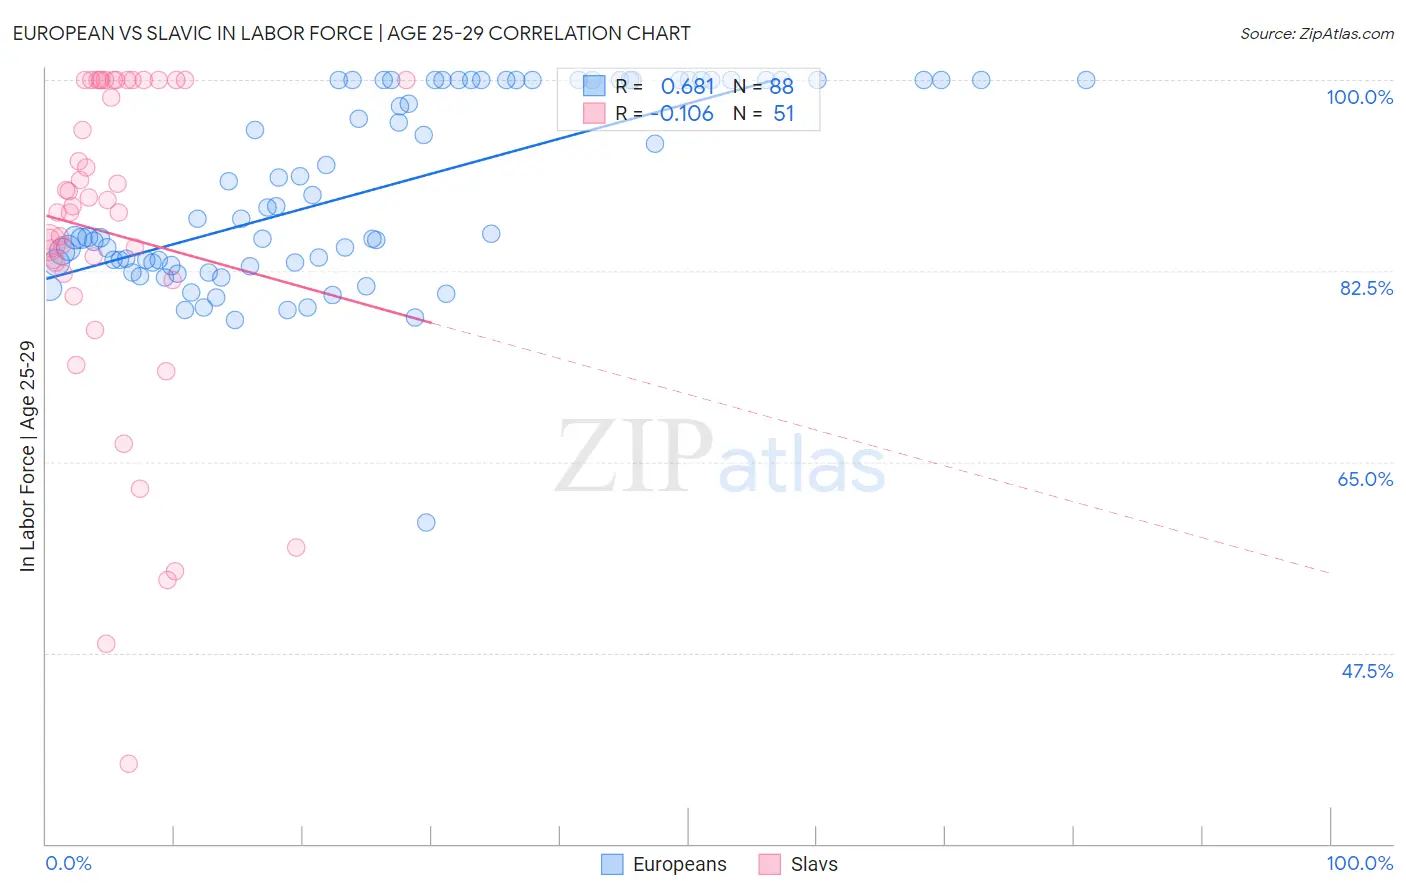
European vs Slavic In Labor Force | Age 25-29 Correlation Chart
The statistical analysis conducted on geographies consisting of 560,805,282 people shows a significant positive correlation between the proportion of Europeans and labor force participation rate among population between the ages 25 and 29 in the United States with a correlation coefficient (R) of 0.681 and weighted average of 84.6%. Similarly, the statistical analysis conducted on geographies consisting of 270,808,387 people shows a poor negative correlation between the proportion of Slavs and labor force participation rate among population between the ages 25 and 29 in the United States with a correlation coefficient (R) of -0.106 and weighted average of 85.1%, a difference of 0.57%.
In Labor Force | Age 25-29 Correlation Summary
| Measurement | European | Slavic |
| Minimum | 59.4% | 37.3% |
| Maximum | 100.0% | 100.0% |
| Range | 40.6% | 62.7% |
| Mean | 89.9% | 85.9% |
| Median | 87.3% | 88.4% |
| Interquartile 25% (IQ1) | 83.3% | 82.3% |
| Interquartile 75% (IQ3) | 100.0% | 100.0% |
| Interquartile Range (IQR) | 16.7% | 17.7% |
| Standard Deviation (Sample) | 8.7% | 15.1% |
| Standard Deviation (Population) | 8.7% | 14.9% |
Similar Demographics by In Labor Force | Age 25-29
Demographics Similar to Europeans by In Labor Force | Age 25-29
In terms of in labor force | age 25-29, the demographic groups most similar to Europeans are Scottish (84.6%, a difference of 0.0%), Immigrants from Norway (84.6%, a difference of 0.010%), Immigrants from South America (84.6%, a difference of 0.020%), Immigrants from Kuwait (84.6%, a difference of 0.020%), and Immigrants from Argentina (84.6%, a difference of 0.030%).
| Demographics | Rating | Rank | In Labor Force | Age 25-29 |
| Hungarians | 47.8 /100 | #175 | Average 84.6% |
| Malaysians | 46.8 /100 | #176 | Average 84.6% |
| Immigrants | China | 45.7 /100 | #177 | Average 84.6% |
| Immigrants | Thailand | 45.2 /100 | #178 | Average 84.6% |
| Immigrants | Argentina | 44.0 /100 | #179 | Average 84.6% |
| Immigrants | South America | 42.9 /100 | #180 | Average 84.6% |
| Immigrants | Norway | 41.9 /100 | #181 | Average 84.6% |
| Europeans | 40.3 /100 | #182 | Average 84.6% |
| Scottish | 40.1 /100 | #183 | Average 84.6% |
| Immigrants | Kuwait | 38.2 /100 | #184 | Fair 84.6% |
| Immigrants | Denmark | 37.0 /100 | #185 | Fair 84.6% |
| Immigrants | Belgium | 35.0 /100 | #186 | Fair 84.6% |
| Immigrants | Portugal | 34.7 /100 | #187 | Fair 84.6% |
| Immigrants | Ukraine | 33.7 /100 | #188 | Fair 84.5% |
| Moroccans | 32.6 /100 | #189 | Fair 84.5% |
Demographics Similar to Slavs by In Labor Force | Age 25-29
In terms of in labor force | age 25-29, the demographic groups most similar to Slavs are Egyptian (85.1%, a difference of 0.0%), Mongolian (85.1%, a difference of 0.010%), Bangladeshi (85.1%, a difference of 0.010%), Immigrants from Switzerland (85.1%, a difference of 0.010%), and Immigrants from Japan (85.1%, a difference of 0.010%).
| Demographics | Rating | Rank | In Labor Force | Age 25-29 |
| Immigrants | Netherlands | 94.6 /100 | #95 | Exceptional 85.1% |
| Immigrants | Romania | 94.6 /100 | #96 | Exceptional 85.1% |
| Immigrants | Sudan | 94.3 /100 | #97 | Exceptional 85.1% |
| Mongolians | 94.1 /100 | #98 | Exceptional 85.1% |
| Bangladeshis | 94.0 /100 | #99 | Exceptional 85.1% |
| Immigrants | Switzerland | 93.9 /100 | #100 | Exceptional 85.1% |
| Egyptians | 93.8 /100 | #101 | Exceptional 85.1% |
| Slavs | 93.7 /100 | #102 | Exceptional 85.1% |
| Immigrants | Japan | 93.5 /100 | #103 | Exceptional 85.1% |
| Immigrants | Zaire | 93.3 /100 | #104 | Exceptional 85.1% |
| Immigrants | Hong Kong | 92.8 /100 | #105 | Exceptional 85.0% |
| Czechoslovakians | 92.6 /100 | #106 | Exceptional 85.0% |
| Immigrants | Southern Europe | 92.3 /100 | #107 | Exceptional 85.0% |
| Immigrants | Austria | 91.9 /100 | #108 | Exceptional 85.0% |
| Costa Ricans | 91.9 /100 | #109 | Exceptional 85.0% |