English vs Colombian In Labor Force | Age 30-34
COMPARE
English
Colombian
In Labor Force | Age 30-34
In Labor Force | Age 30-34 Comparison
English
Colombians
84.0%
IN LABOR FORCE | AGE 30-34
1.4/ 100
METRIC RATING
239th/ 347
METRIC RANK
84.9%
IN LABOR FORCE | AGE 30-34
82.2/ 100
METRIC RATING
143rd/ 347
METRIC RANK
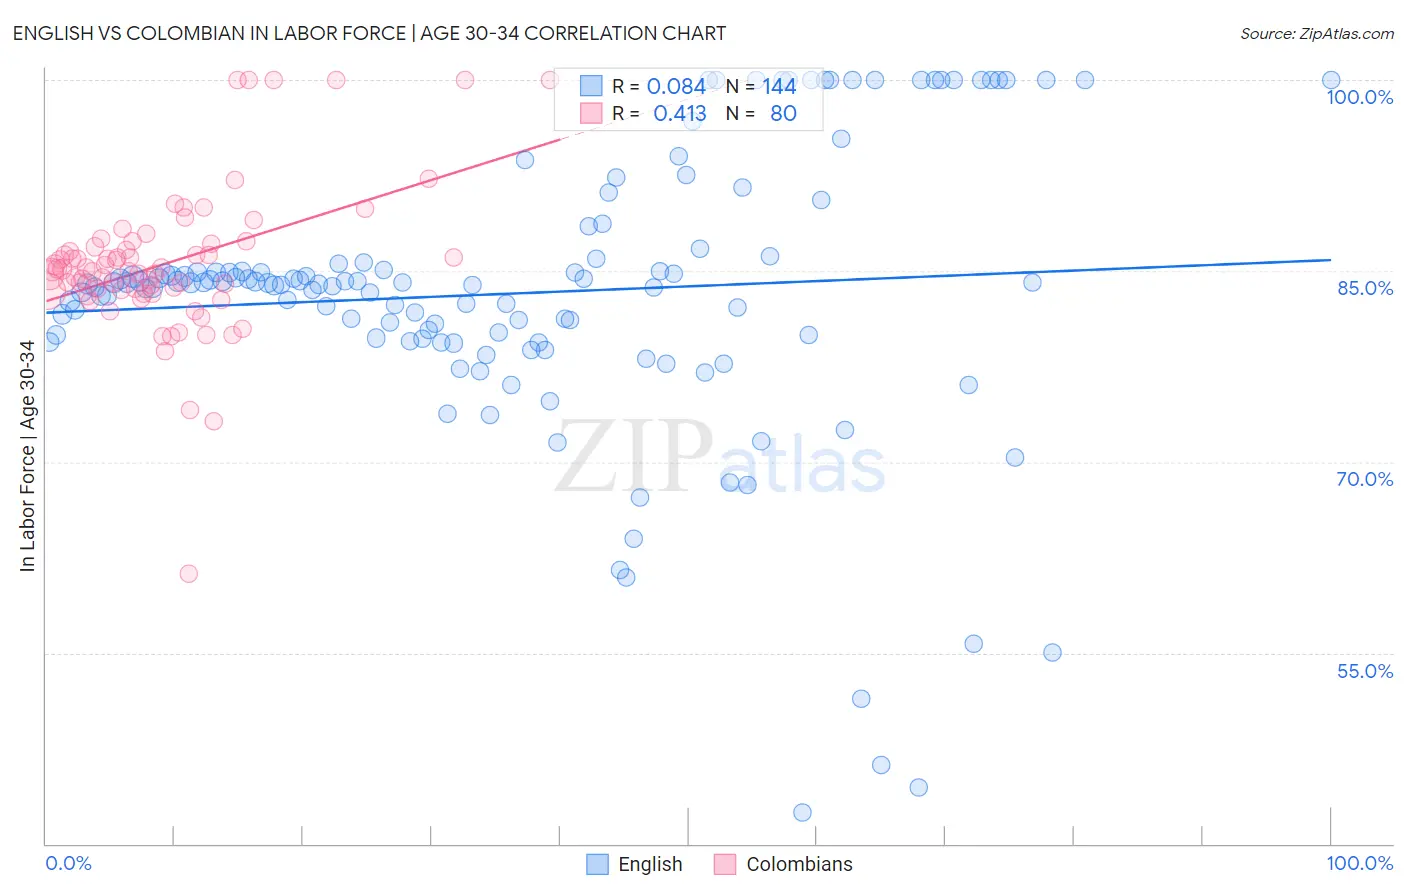
English vs Colombian In Labor Force | Age 30-34 Correlation Chart
The statistical analysis conducted on geographies consisting of 577,859,579 people shows a slight positive correlation between the proportion of English and labor force participation rate among population between the ages 30 and 34 in the United States with a correlation coefficient (R) of 0.084 and weighted average of 84.0%. Similarly, the statistical analysis conducted on geographies consisting of 419,380,718 people shows a moderate positive correlation between the proportion of Colombians and labor force participation rate among population between the ages 30 and 34 in the United States with a correlation coefficient (R) of 0.413 and weighted average of 84.9%, a difference of 1.0%.
In Labor Force | Age 30-34 Correlation Summary
| Measurement | English | Colombian |
| Minimum | 42.5% | 61.2% |
| Maximum | 100.0% | 100.0% |
| Range | 57.5% | 38.8% |
| Mean | 83.2% | 85.6% |
| Median | 84.0% | 85.1% |
| Interquartile 25% (IQ1) | 79.7% | 83.5% |
| Interquartile 75% (IQ3) | 85.6% | 87.0% |
| Interquartile Range (IQR) | 5.9% | 3.6% |
| Standard Deviation (Sample) | 11.1% | 5.9% |
| Standard Deviation (Population) | 11.0% | 5.8% |
Similar Demographics by In Labor Force | Age 30-34
Demographics Similar to English by In Labor Force | Age 30-34
In terms of in labor force | age 30-34, the demographic groups most similar to English are Immigrants from Barbados (84.0%, a difference of 0.0%), Venezuelan (84.0%, a difference of 0.0%), Celtic (84.1%, a difference of 0.010%), U.S. Virgin Islander (84.1%, a difference of 0.020%), and Immigrants from Portugal (84.0%, a difference of 0.020%).
| Demographics | Rating | Rank | In Labor Force | Age 30-34 |
| Immigrants | Immigrants | 2.0 /100 | #232 | Tragic 84.1% |
| West Indians | 1.9 /100 | #233 | Tragic 84.1% |
| Haitians | 1.8 /100 | #234 | Tragic 84.1% |
| French American Indians | 1.7 /100 | #235 | Tragic 84.1% |
| U.S. Virgin Islanders | 1.5 /100 | #236 | Tragic 84.1% |
| Celtics | 1.4 /100 | #237 | Tragic 84.1% |
| Immigrants | Barbados | 1.4 /100 | #238 | Tragic 84.0% |
| English | 1.4 /100 | #239 | Tragic 84.0% |
| Venezuelans | 1.3 /100 | #240 | Tragic 84.0% |
| Immigrants | Portugal | 1.2 /100 | #241 | Tragic 84.0% |
| Immigrants | Oceania | 1.1 /100 | #242 | Tragic 84.0% |
| Immigrants | Caribbean | 1.1 /100 | #243 | Tragic 84.0% |
| Basques | 0.9 /100 | #244 | Tragic 84.0% |
| Immigrants | Venezuela | 0.9 /100 | #245 | Tragic 84.0% |
| Central Americans | 0.9 /100 | #246 | Tragic 84.0% |
Demographics Similar to Colombians by In Labor Force | Age 30-34
In terms of in labor force | age 30-34, the demographic groups most similar to Colombians are Immigrants from Indonesia (84.9%, a difference of 0.030%), Chilean (84.9%, a difference of 0.040%), Uruguayan (84.9%, a difference of 0.040%), Palestinian (84.9%, a difference of 0.050%), and Immigrants from Vietnam (85.0%, a difference of 0.060%).
| Demographics | Rating | Rank | In Labor Force | Age 30-34 |
| Jordanians | 88.6 /100 | #136 | Excellent 85.0% |
| South Africans | 88.0 /100 | #137 | Excellent 85.0% |
| Sri Lankans | 87.8 /100 | #138 | Excellent 85.0% |
| Bhutanese | 87.5 /100 | #139 | Excellent 85.0% |
| Immigrants | Vietnam | 86.5 /100 | #140 | Excellent 85.0% |
| Chileans | 85.3 /100 | #141 | Excellent 84.9% |
| Immigrants | Indonesia | 84.3 /100 | #142 | Excellent 84.9% |
| Colombians | 82.2 /100 | #143 | Excellent 84.9% |
| Uruguayans | 78.5 /100 | #144 | Good 84.9% |
| Palestinians | 77.7 /100 | #145 | Good 84.9% |
| Immigrants | Saudi Arabia | 76.6 /100 | #146 | Good 84.9% |
| Immigrants | Colombia | 76.3 /100 | #147 | Good 84.9% |
| Immigrants | Pakistan | 76.2 /100 | #148 | Good 84.9% |
| Immigrants | Ukraine | 75.1 /100 | #149 | Good 84.8% |
| Germans | 75.1 /100 | #150 | Good 84.8% |