Immigrants from Singapore vs Barbadian In Labor Force | Age 16-19
COMPARE
Immigrants from Singapore
Barbadian
In Labor Force | Age 16-19
In Labor Force | Age 16-19 Comparison
Immigrants from Singapore
Barbadians
33.5%
IN LABOR FORCE | AGE 16-19
0.1/ 100
METRIC RATING
289th/ 347
METRIC RANK
31.0%
IN LABOR FORCE | AGE 16-19
0.0/ 100
METRIC RATING
329th/ 347
METRIC RANK
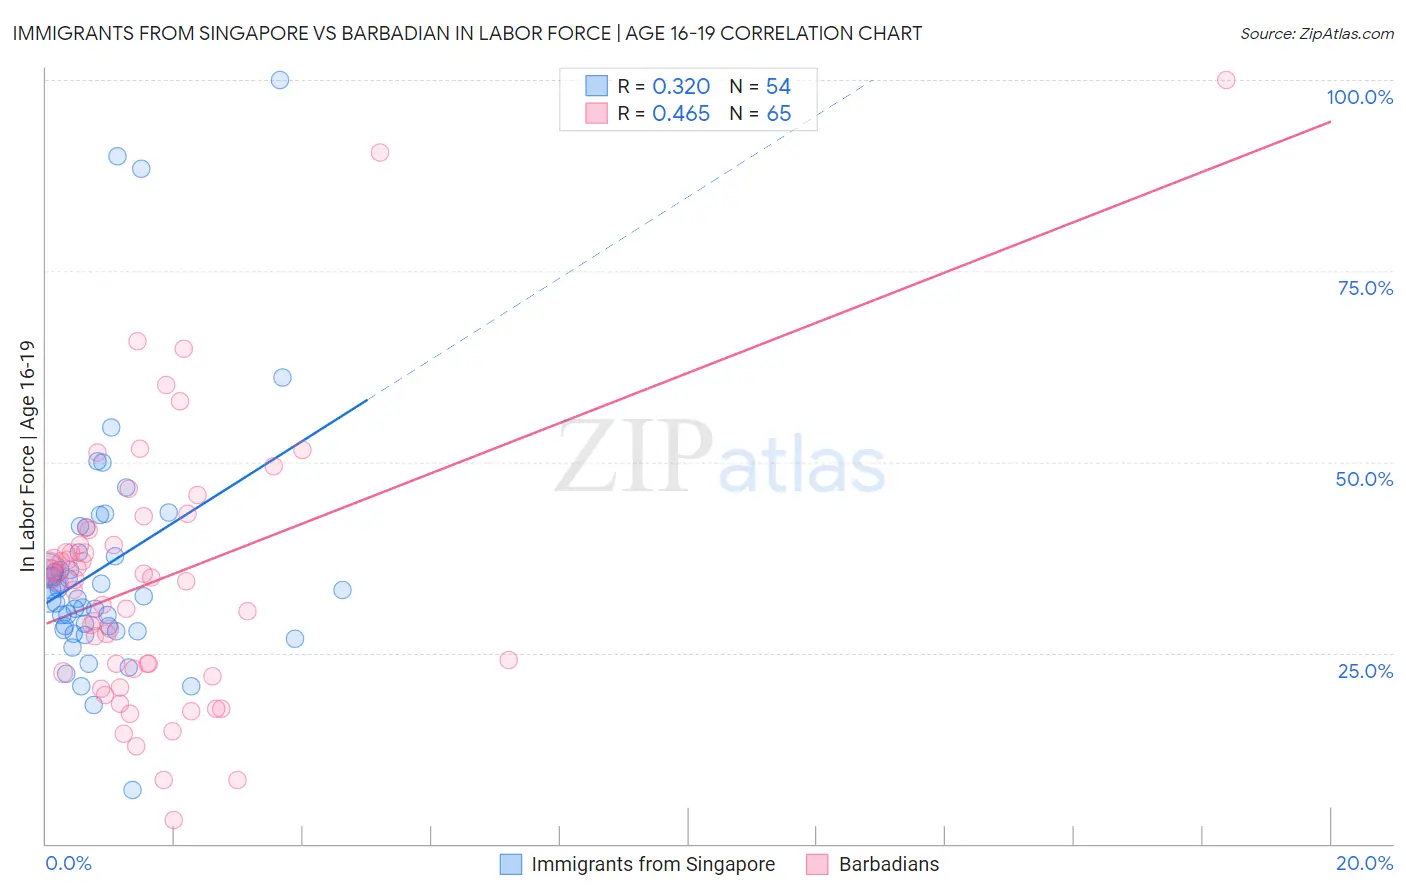
Immigrants from Singapore vs Barbadian In Labor Force | Age 16-19 Correlation Chart
The statistical analysis conducted on geographies consisting of 137,453,014 people shows a mild positive correlation between the proportion of Immigrants from Singapore and labor force participation rate among population between the ages 16 and 19 in the United States with a correlation coefficient (R) of 0.320 and weighted average of 33.5%. Similarly, the statistical analysis conducted on geographies consisting of 141,232,265 people shows a moderate positive correlation between the proportion of Barbadians and labor force participation rate among population between the ages 16 and 19 in the United States with a correlation coefficient (R) of 0.465 and weighted average of 31.0%, a difference of 8.0%.
In Labor Force | Age 16-19 Correlation Summary
| Measurement | Immigrants from Singapore | Barbadian |
| Minimum | 7.1% | 3.1% |
| Maximum | 100.0% | 100.0% |
| Range | 92.9% | 96.9% |
| Mean | 36.4% | 34.4% |
| Median | 32.9% | 34.6% |
| Interquartile 25% (IQ1) | 28.1% | 22.6% |
| Interquartile 75% (IQ3) | 38.2% | 40.1% |
| Interquartile Range (IQR) | 10.1% | 17.4% |
| Standard Deviation (Sample) | 16.6% | 17.3% |
| Standard Deviation (Population) | 16.4% | 17.1% |
Similar Demographics by In Labor Force | Age 16-19
Demographics Similar to Immigrants from Singapore by In Labor Force | Age 16-19
In terms of in labor force | age 16-19, the demographic groups most similar to Immigrants from Singapore are Immigrants from Indonesia (33.5%, a difference of 0.0%), Nepalese (33.5%, a difference of 0.040%), Immigrants from Colombia (33.5%, a difference of 0.14%), Immigrants from Belarus (33.4%, a difference of 0.21%), and South American (33.6%, a difference of 0.27%).
| Demographics | Rating | Rank | In Labor Force | Age 16-19 |
| Immigrants | Korea | 0.3 /100 | #282 | Tragic 33.8% |
| Immigrants | Venezuela | 0.2 /100 | #283 | Tragic 33.7% |
| Immigrants | Spain | 0.2 /100 | #284 | Tragic 33.7% |
| U.S. Virgin Islanders | 0.2 /100 | #285 | Tragic 33.6% |
| South Americans | 0.2 /100 | #286 | Tragic 33.6% |
| Nepalese | 0.1 /100 | #287 | Tragic 33.5% |
| Immigrants | Indonesia | 0.1 /100 | #288 | Tragic 33.5% |
| Immigrants | Singapore | 0.1 /100 | #289 | Tragic 33.5% |
| Immigrants | Colombia | 0.1 /100 | #290 | Tragic 33.5% |
| Immigrants | Belarus | 0.1 /100 | #291 | Tragic 33.4% |
| Haitians | 0.1 /100 | #292 | Tragic 33.4% |
| Immigrants | South America | 0.1 /100 | #293 | Tragic 33.3% |
| Argentineans | 0.1 /100 | #294 | Tragic 33.3% |
| Yup'ik | 0.1 /100 | #295 | Tragic 33.3% |
| Jamaicans | 0.1 /100 | #296 | Tragic 33.2% |
Demographics Similar to Barbadians by In Labor Force | Age 16-19
In terms of in labor force | age 16-19, the demographic groups most similar to Barbadians are Immigrants from Ecuador (31.0%, a difference of 0.030%), Immigrants from Taiwan (31.0%, a difference of 0.070%), Lumbee (31.0%, a difference of 0.12%), Immigrants from Dominican Republic (31.1%, a difference of 0.23%), and Trinidadian and Tobagonian (30.9%, a difference of 0.27%).
| Demographics | Rating | Rank | In Labor Force | Age 16-19 |
| Tohono O'odham | 0.0 /100 | #322 | Tragic 31.3% |
| Immigrants | Caribbean | 0.0 /100 | #323 | Tragic 31.2% |
| Dominicans | 0.0 /100 | #324 | Tragic 31.2% |
| Immigrants | China | 0.0 /100 | #325 | Tragic 31.1% |
| Immigrants | Dominican Republic | 0.0 /100 | #326 | Tragic 31.1% |
| Immigrants | Taiwan | 0.0 /100 | #327 | Tragic 31.0% |
| Immigrants | Ecuador | 0.0 /100 | #328 | Tragic 31.0% |
| Barbadians | 0.0 /100 | #329 | Tragic 31.0% |
| Lumbee | 0.0 /100 | #330 | Tragic 31.0% |
| Trinidadians and Tobagonians | 0.0 /100 | #331 | Tragic 30.9% |
| Immigrants | Israel | 0.0 /100 | #332 | Tragic 30.5% |
| Immigrants | Hong Kong | 0.0 /100 | #333 | Tragic 30.5% |
| Puerto Ricans | 0.0 /100 | #334 | Tragic 30.3% |
| Immigrants | Cuba | 0.0 /100 | #335 | Tragic 30.2% |
| Immigrants | Trinidad and Tobago | 0.0 /100 | #336 | Tragic 30.2% |