Dutch West Indian vs Immigrants from Lebanon In Labor Force | Age > 16
COMPARE
Dutch West Indian
Immigrants from Lebanon
In Labor Force | Age > 16
In Labor Force | Age > 16 Comparison
Dutch West Indians
Immigrants from Lebanon
61.7%
IN LABOR FORCE | AGE > 16
0.0/ 100
METRIC RATING
328th/ 347
METRIC RANK
64.5%
IN LABOR FORCE | AGE > 16
3.2/ 100
METRIC RATING
243rd/ 347
METRIC RANK
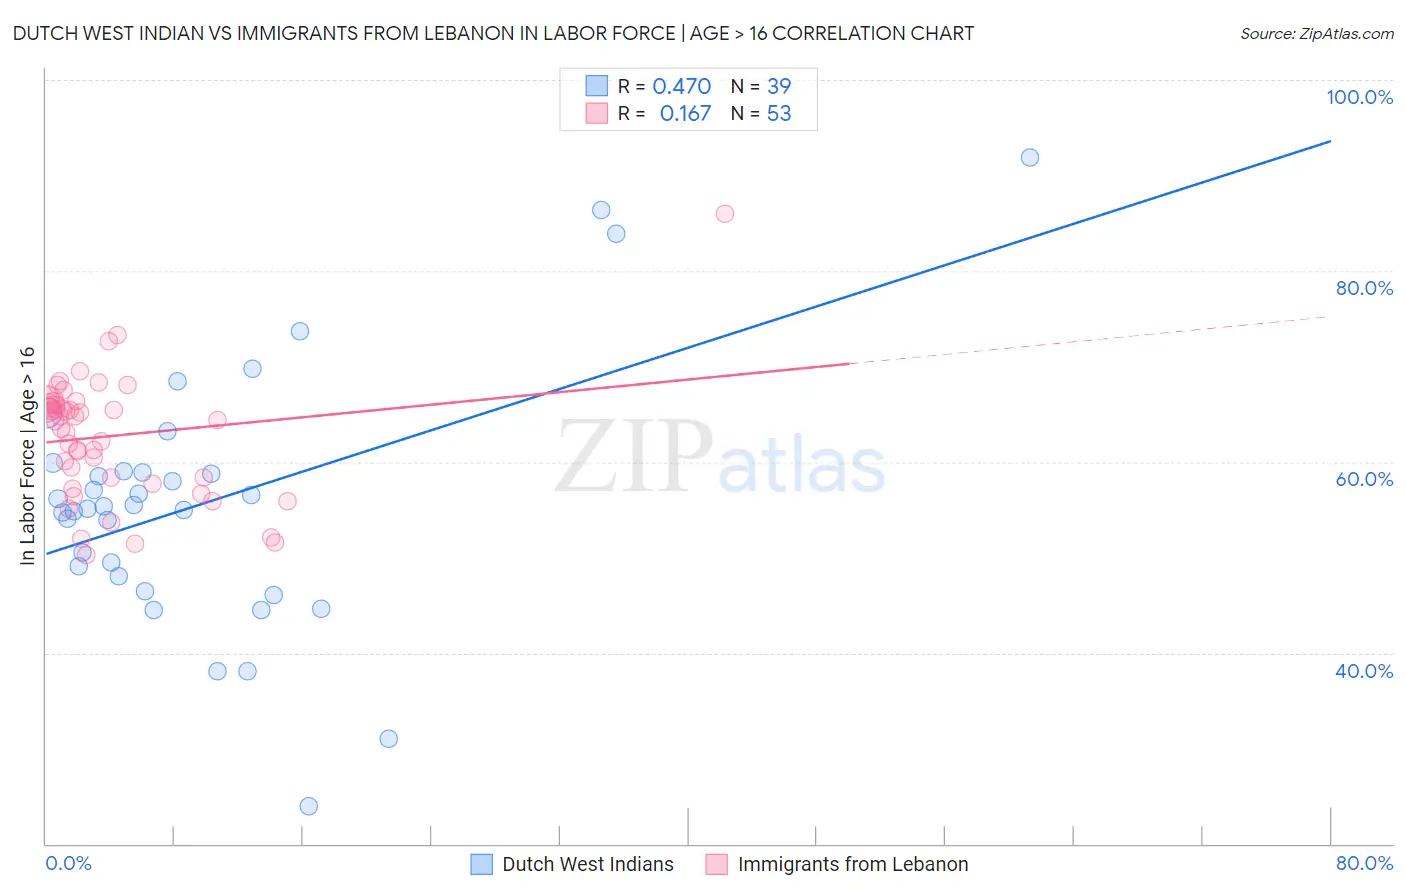
Dutch West Indian vs Immigrants from Lebanon In Labor Force | Age > 16 Correlation Chart
The statistical analysis conducted on geographies consisting of 85,770,506 people shows a moderate positive correlation between the proportion of Dutch West Indians and labor force participation rate among population ages 16 and over in the United States with a correlation coefficient (R) of 0.470 and weighted average of 61.7%. Similarly, the statistical analysis conducted on geographies consisting of 217,155,604 people shows a poor positive correlation between the proportion of Immigrants from Lebanon and labor force participation rate among population ages 16 and over in the United States with a correlation coefficient (R) of 0.167 and weighted average of 64.5%, a difference of 4.6%.
In Labor Force | Age > 16 Correlation Summary
| Measurement | Dutch West Indian | Immigrants from Lebanon |
| Minimum | 23.9% | 50.2% |
| Maximum | 91.9% | 86.0% |
| Range | 68.0% | 35.8% |
| Mean | 55.8% | 62.7% |
| Median | 55.4% | 64.4% |
| Interquartile 25% (IQ1) | 48.0% | 58.1% |
| Interquartile 75% (IQ3) | 59.0% | 66.1% |
| Interquartile Range (IQR) | 11.1% | 8.0% |
| Standard Deviation (Sample) | 13.5% | 6.5% |
| Standard Deviation (Population) | 13.3% | 6.4% |
Similar Demographics by In Labor Force | Age > 16
Demographics Similar to Dutch West Indians by In Labor Force | Age > 16
In terms of in labor force | age > 16, the demographic groups most similar to Dutch West Indians are Cajun (61.8%, a difference of 0.16%), Sioux (61.8%, a difference of 0.27%), Choctaw (61.5%, a difference of 0.36%), Cherokee (61.9%, a difference of 0.45%), and Cheyenne (62.0%, a difference of 0.49%).
| Demographics | Rating | Rank | In Labor Force | Age > 16 |
| Americans | 0.0 /100 | #321 | Tragic 62.1% |
| Ottawa | 0.0 /100 | #322 | Tragic 62.0% |
| Seminole | 0.0 /100 | #323 | Tragic 62.0% |
| Cheyenne | 0.0 /100 | #324 | Tragic 62.0% |
| Cherokee | 0.0 /100 | #325 | Tragic 61.9% |
| Sioux | 0.0 /100 | #326 | Tragic 61.8% |
| Cajuns | 0.0 /100 | #327 | Tragic 61.8% |
| Dutch West Indians | 0.0 /100 | #328 | Tragic 61.7% |
| Choctaw | 0.0 /100 | #329 | Tragic 61.5% |
| Creek | 0.0 /100 | #330 | Tragic 61.3% |
| Ute | 0.0 /100 | #331 | Tragic 60.9% |
| Crow | 0.0 /100 | #332 | Tragic 60.8% |
| Paiute | 0.0 /100 | #333 | Tragic 60.7% |
| Apache | 0.0 /100 | #334 | Tragic 60.7% |
| Natives/Alaskans | 0.0 /100 | #335 | Tragic 60.6% |
Demographics Similar to Immigrants from Lebanon by In Labor Force | Age > 16
In terms of in labor force | age > 16, the demographic groups most similar to Immigrants from Lebanon are Immigrants from Netherlands (64.5%, a difference of 0.010%), Tsimshian (64.5%, a difference of 0.020%), West Indian (64.5%, a difference of 0.020%), Immigrants from Bangladesh (64.5%, a difference of 0.030%), and Immigrants from Dominica (64.5%, a difference of 0.030%).
| Demographics | Rating | Rank | In Labor Force | Age > 16 |
| Immigrants | Norway | 4.6 /100 | #236 | Tragic 64.6% |
| Italians | 4.6 /100 | #237 | Tragic 64.6% |
| Lebanese | 3.9 /100 | #238 | Tragic 64.5% |
| Immigrants | Hungary | 3.8 /100 | #239 | Tragic 64.5% |
| Immigrants | Bangladesh | 3.6 /100 | #240 | Tragic 64.5% |
| Immigrants | Dominica | 3.5 /100 | #241 | Tragic 64.5% |
| Immigrants | Netherlands | 3.4 /100 | #242 | Tragic 64.5% |
| Immigrants | Lebanon | 3.2 /100 | #243 | Tragic 64.5% |
| Tsimshian | 3.1 /100 | #244 | Tragic 64.5% |
| West Indians | 3.0 /100 | #245 | Tragic 64.5% |
| Immigrants | Caribbean | 2.3 /100 | #246 | Tragic 64.4% |
| Swiss | 2.1 /100 | #247 | Tragic 64.4% |
| Immigrants | Barbados | 2.1 /100 | #248 | Tragic 64.4% |
| Germans | 1.8 /100 | #249 | Tragic 64.4% |
| British West Indians | 1.8 /100 | #250 | Tragic 64.4% |