Dutch West Indian vs Immigrants from Somalia Unemployment Among Women with Children Ages 6 to 17 years
COMPARE
Dutch West Indian
Immigrants from Somalia
Unemployment Among Women with Children Ages 6 to 17 years
Unemployment Among Women with Children Ages 6 to 17 years Comparison
Dutch West Indians
Immigrants from Somalia
10.2%
UNEMPLOYMENT AMONG WOMEN WITH CHILDREN AGES 6 TO 17 YEARS
0.0/ 100
METRIC RATING
308th/ 347
METRIC RANK
8.0%
UNEMPLOYMENT AMONG WOMEN WITH CHILDREN AGES 6 TO 17 YEARS
100.0/ 100
METRIC RATING
42nd/ 347
METRIC RANK
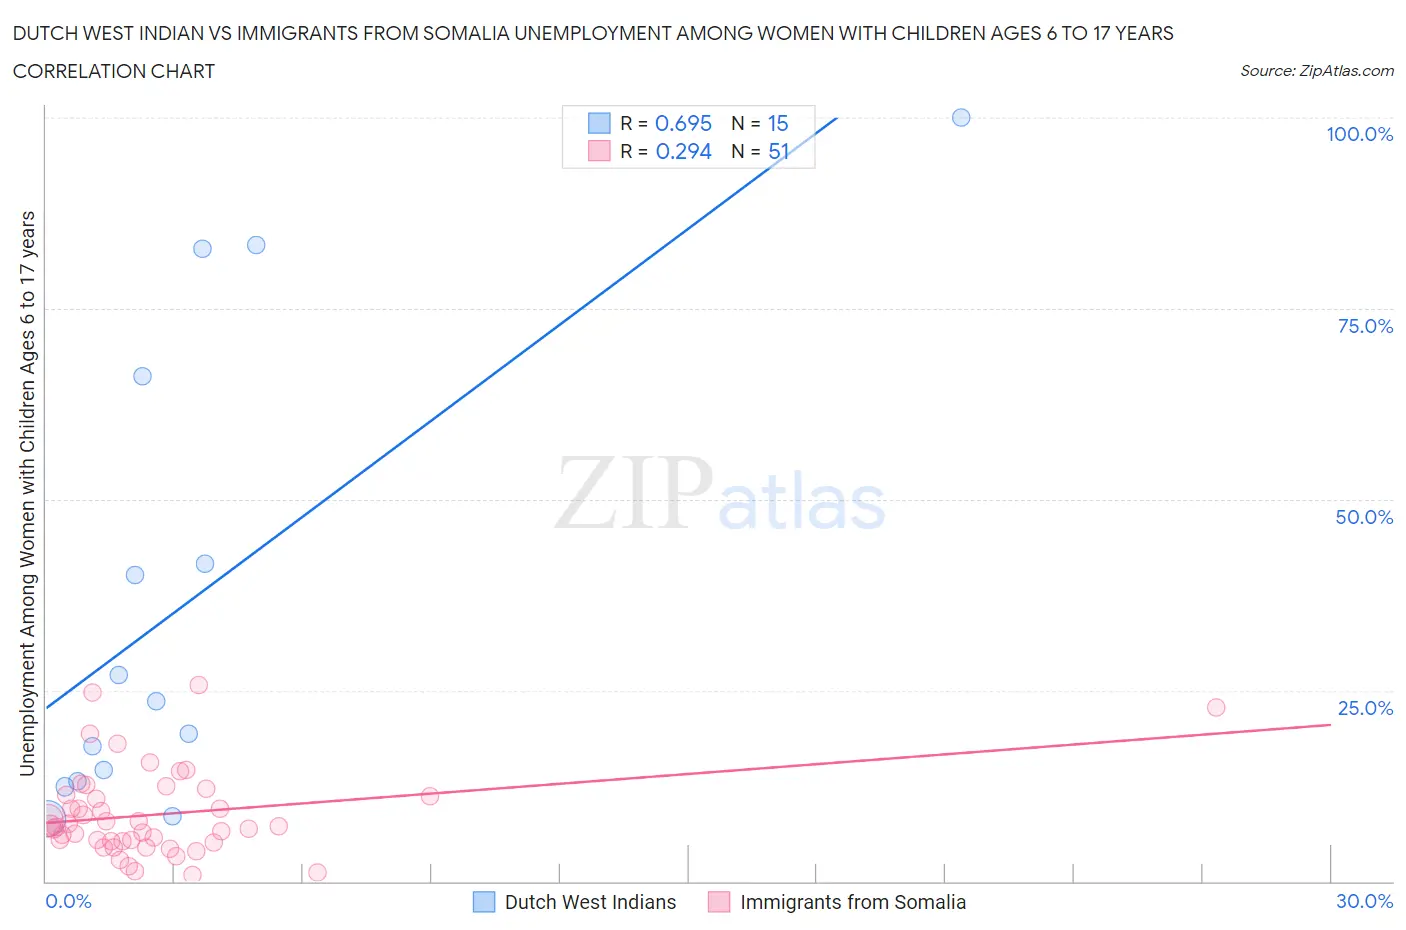
Dutch West Indian vs Immigrants from Somalia Unemployment Among Women with Children Ages 6 to 17 years Correlation Chart
The statistical analysis conducted on geographies consisting of 73,777,912 people shows a significant positive correlation between the proportion of Dutch West Indians and unemployment rate among women with children between the ages 6 and 17 in the United States with a correlation coefficient (R) of 0.695 and weighted average of 10.2%. Similarly, the statistical analysis conducted on geographies consisting of 81,291,755 people shows a weak positive correlation between the proportion of Immigrants from Somalia and unemployment rate among women with children between the ages 6 and 17 in the United States with a correlation coefficient (R) of 0.294 and weighted average of 8.0%, a difference of 27.3%.
Unemployment Among Women with Children Ages 6 to 17 years Correlation Summary
| Measurement | Dutch West Indian | Immigrants from Somalia |
| Minimum | 8.2% | 0.90% |
| Maximum | 100.0% | 25.7% |
| Range | 91.8% | 24.8% |
| Mean | 37.2% | 8.8% |
| Median | 23.6% | 7.2% |
| Interquartile 25% (IQ1) | 13.0% | 5.2% |
| Interquartile 75% (IQ3) | 66.1% | 11.3% |
| Interquartile Range (IQR) | 53.1% | 6.1% |
| Standard Deviation (Sample) | 30.9% | 5.7% |
| Standard Deviation (Population) | 29.9% | 5.7% |
Similar Demographics by Unemployment Among Women with Children Ages 6 to 17 years
Demographics Similar to Dutch West Indians by Unemployment Among Women with Children Ages 6 to 17 years
In terms of unemployment among women with children ages 6 to 17 years, the demographic groups most similar to Dutch West Indians are Immigrants from Senegal (10.2%, a difference of 0.010%), Paraguayan (10.2%, a difference of 0.24%), Immigrants from Nigeria (10.2%, a difference of 0.53%), French Canadian (10.3%, a difference of 0.54%), and Immigrants from Venezuela (10.2%, a difference of 0.59%).
| Demographics | Rating | Rank | Unemployment Among Women with Children Ages 6 to 17 years |
| Immigrants | Bahamas | 0.0 /100 | #301 | Tragic 10.1% |
| Venezuelans | 0.0 /100 | #302 | Tragic 10.2% |
| Immigrants | Ecuador | 0.0 /100 | #303 | Tragic 10.2% |
| Immigrants | Venezuela | 0.0 /100 | #304 | Tragic 10.2% |
| Immigrants | Nigeria | 0.0 /100 | #305 | Tragic 10.2% |
| Paraguayans | 0.0 /100 | #306 | Tragic 10.2% |
| Immigrants | Senegal | 0.0 /100 | #307 | Tragic 10.2% |
| Dutch West Indians | 0.0 /100 | #308 | Tragic 10.2% |
| French Canadians | 0.0 /100 | #309 | Tragic 10.3% |
| Alaska Natives | 0.0 /100 | #310 | Tragic 10.3% |
| Immigrants | Liberia | 0.0 /100 | #311 | Tragic 10.3% |
| Africans | 0.0 /100 | #312 | Tragic 10.4% |
| Americans | 0.0 /100 | #313 | Tragic 10.4% |
| Immigrants | Cabo Verde | 0.0 /100 | #314 | Tragic 10.4% |
| Bahamians | 0.0 /100 | #315 | Tragic 10.4% |
Demographics Similar to Immigrants from Somalia by Unemployment Among Women with Children Ages 6 to 17 years
In terms of unemployment among women with children ages 6 to 17 years, the demographic groups most similar to Immigrants from Somalia are Bhutanese (8.1%, a difference of 0.14%), Immigrants from Sweden (8.1%, a difference of 0.18%), Immigrants from Bulgaria (8.1%, a difference of 0.22%), Icelander (8.1%, a difference of 0.24%), and Iranian (8.0%, a difference of 0.27%).
| Demographics | Rating | Rank | Unemployment Among Women with Children Ages 6 to 17 years |
| Immigrants | South Central Asia | 100.0 /100 | #35 | Exceptional 7.9% |
| Burmese | 100.0 /100 | #36 | Exceptional 8.0% |
| Asians | 100.0 /100 | #37 | Exceptional 8.0% |
| Alsatians | 100.0 /100 | #38 | Exceptional 8.0% |
| Somalis | 100.0 /100 | #39 | Exceptional 8.0% |
| Immigrants | Zimbabwe | 100.0 /100 | #40 | Exceptional 8.0% |
| Iranians | 100.0 /100 | #41 | Exceptional 8.0% |
| Immigrants | Somalia | 100.0 /100 | #42 | Exceptional 8.0% |
| Bhutanese | 100.0 /100 | #43 | Exceptional 8.1% |
| Immigrants | Sweden | 100.0 /100 | #44 | Exceptional 8.1% |
| Immigrants | Bulgaria | 100.0 /100 | #45 | Exceptional 8.1% |
| Icelanders | 100.0 /100 | #46 | Exceptional 8.1% |
| Immigrants | Switzerland | 100.0 /100 | #47 | Exceptional 8.1% |
| Immigrants | Asia | 100.0 /100 | #48 | Exceptional 8.1% |
| Immigrants | Oceania | 100.0 /100 | #49 | Exceptional 8.1% |