Dutch West Indian vs Peruvian In Labor Force | Age 20-64
COMPARE
Dutch West Indian
Peruvian
In Labor Force | Age 20-64
In Labor Force | Age 20-64 Comparison
Dutch West Indians
Peruvians
75.5%
IN LABOR FORCE | AGE 20-64
0.0/ 100
METRIC RATING
322nd/ 347
METRIC RANK
80.3%
IN LABOR FORCE | AGE 20-64
99.1/ 100
METRIC RATING
54th/ 347
METRIC RANK
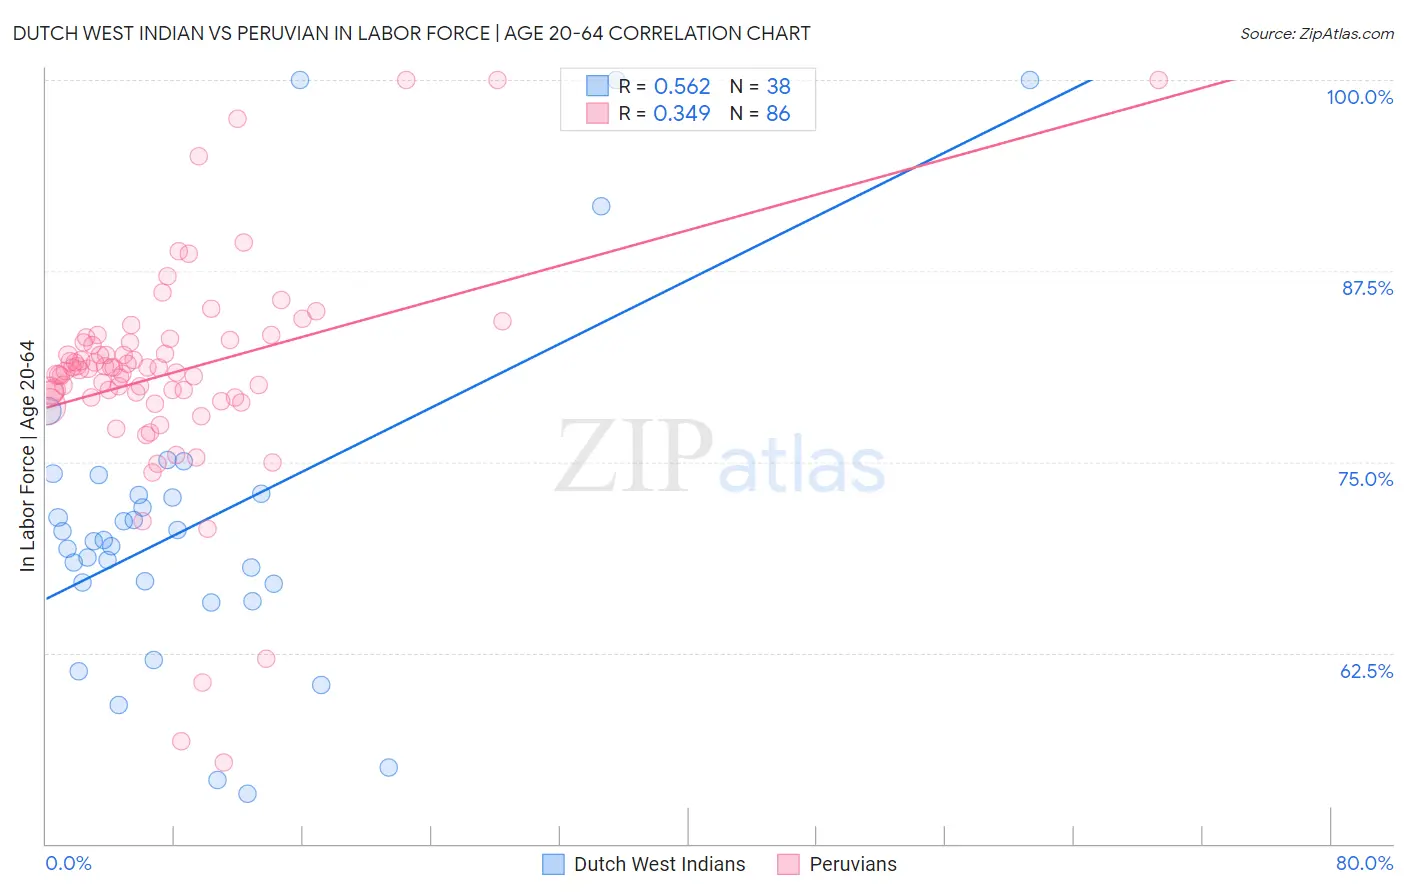
Dutch West Indian vs Peruvian In Labor Force | Age 20-64 Correlation Chart
The statistical analysis conducted on geographies consisting of 85,770,451 people shows a substantial positive correlation between the proportion of Dutch West Indians and labor force participation rate among population between the ages 20 and 64 in the United States with a correlation coefficient (R) of 0.562 and weighted average of 75.5%. Similarly, the statistical analysis conducted on geographies consisting of 363,253,233 people shows a mild positive correlation between the proportion of Peruvians and labor force participation rate among population between the ages 20 and 64 in the United States with a correlation coefficient (R) of 0.349 and weighted average of 80.3%, a difference of 6.4%.
In Labor Force | Age 20-64 Correlation Summary
| Measurement | Dutch West Indian | Peruvian |
| Minimum | 53.3% | 55.3% |
| Maximum | 100.0% | 100.0% |
| Range | 46.7% | 44.7% |
| Mean | 71.2% | 80.8% |
| Median | 69.9% | 81.1% |
| Interquartile 25% (IQ1) | 67.0% | 79.2% |
| Interquartile 75% (IQ3) | 72.9% | 82.8% |
| Interquartile Range (IQR) | 5.9% | 3.6% |
| Standard Deviation (Sample) | 11.0% | 7.2% |
| Standard Deviation (Population) | 10.9% | 7.2% |
Similar Demographics by In Labor Force | Age 20-64
Demographics Similar to Dutch West Indians by In Labor Force | Age 20-64
In terms of in labor force | age 20-64, the demographic groups most similar to Dutch West Indians are Cajun (75.5%, a difference of 0.040%), Seminole (75.5%, a difference of 0.050%), Choctaw (75.4%, a difference of 0.10%), Menominee (75.3%, a difference of 0.23%), and Yakama (75.8%, a difference of 0.40%).
| Demographics | Rating | Rank | In Labor Force | Age 20-64 |
| Ottawa | 0.0 /100 | #315 | Tragic 76.7% |
| Yaqui | 0.0 /100 | #316 | Tragic 76.5% |
| Cherokee | 0.0 /100 | #317 | Tragic 76.2% |
| Chickasaw | 0.0 /100 | #318 | Tragic 76.2% |
| Inupiat | 0.0 /100 | #319 | Tragic 76.1% |
| Yakama | 0.0 /100 | #320 | Tragic 75.8% |
| Seminole | 0.0 /100 | #321 | Tragic 75.5% |
| Dutch West Indians | 0.0 /100 | #322 | Tragic 75.5% |
| Cajuns | 0.0 /100 | #323 | Tragic 75.5% |
| Choctaw | 0.0 /100 | #324 | Tragic 75.4% |
| Menominee | 0.0 /100 | #325 | Tragic 75.3% |
| Creek | 0.0 /100 | #326 | Tragic 75.1% |
| Sioux | 0.0 /100 | #327 | Tragic 75.0% |
| Kiowa | 0.0 /100 | #328 | Tragic 75.0% |
| Cheyenne | 0.0 /100 | #329 | Tragic 74.8% |
Demographics Similar to Peruvians by In Labor Force | Age 20-64
In terms of in labor force | age 20-64, the demographic groups most similar to Peruvians are Immigrants from Peru (80.3%, a difference of 0.010%), Immigrants from Cabo Verde (80.3%, a difference of 0.020%), Turkish (80.3%, a difference of 0.030%), Immigrants from Sri Lanka (80.4%, a difference of 0.040%), and Immigrants from Northern Africa (80.3%, a difference of 0.040%).
| Demographics | Rating | Rank | In Labor Force | Age 20-64 |
| Immigrants | Africa | 99.6 /100 | #47 | Exceptional 80.4% |
| Immigrants | Hong Kong | 99.5 /100 | #48 | Exceptional 80.4% |
| Immigrants | Greece | 99.4 /100 | #49 | Exceptional 80.4% |
| Immigrants | Sudan | 99.4 /100 | #50 | Exceptional 80.4% |
| Immigrants | Sri Lanka | 99.3 /100 | #51 | Exceptional 80.4% |
| Turks | 99.2 /100 | #52 | Exceptional 80.3% |
| Immigrants | Peru | 99.2 /100 | #53 | Exceptional 80.3% |
| Peruvians | 99.1 /100 | #54 | Exceptional 80.3% |
| Immigrants | Cabo Verde | 99.0 /100 | #55 | Exceptional 80.3% |
| Immigrants | Northern Africa | 99.0 /100 | #56 | Exceptional 80.3% |
| Afghans | 98.9 /100 | #57 | Exceptional 80.3% |
| Serbians | 98.9 /100 | #58 | Exceptional 80.3% |
| Swedes | 98.9 /100 | #59 | Exceptional 80.3% |
| Tongans | 98.8 /100 | #60 | Exceptional 80.3% |
| Burmese | 98.8 /100 | #61 | Exceptional 80.3% |