Dutch West Indian vs Immigrants from Vietnam In Labor Force | Age 20-64
COMPARE
Dutch West Indian
Immigrants from Vietnam
In Labor Force | Age 20-64
In Labor Force | Age 20-64 Comparison
Dutch West Indians
Immigrants from Vietnam
75.5%
IN LABOR FORCE | AGE 20-64
0.0/ 100
METRIC RATING
322nd/ 347
METRIC RANK
80.0%
IN LABOR FORCE | AGE 20-64
92.7/ 100
METRIC RATING
117th/ 347
METRIC RANK
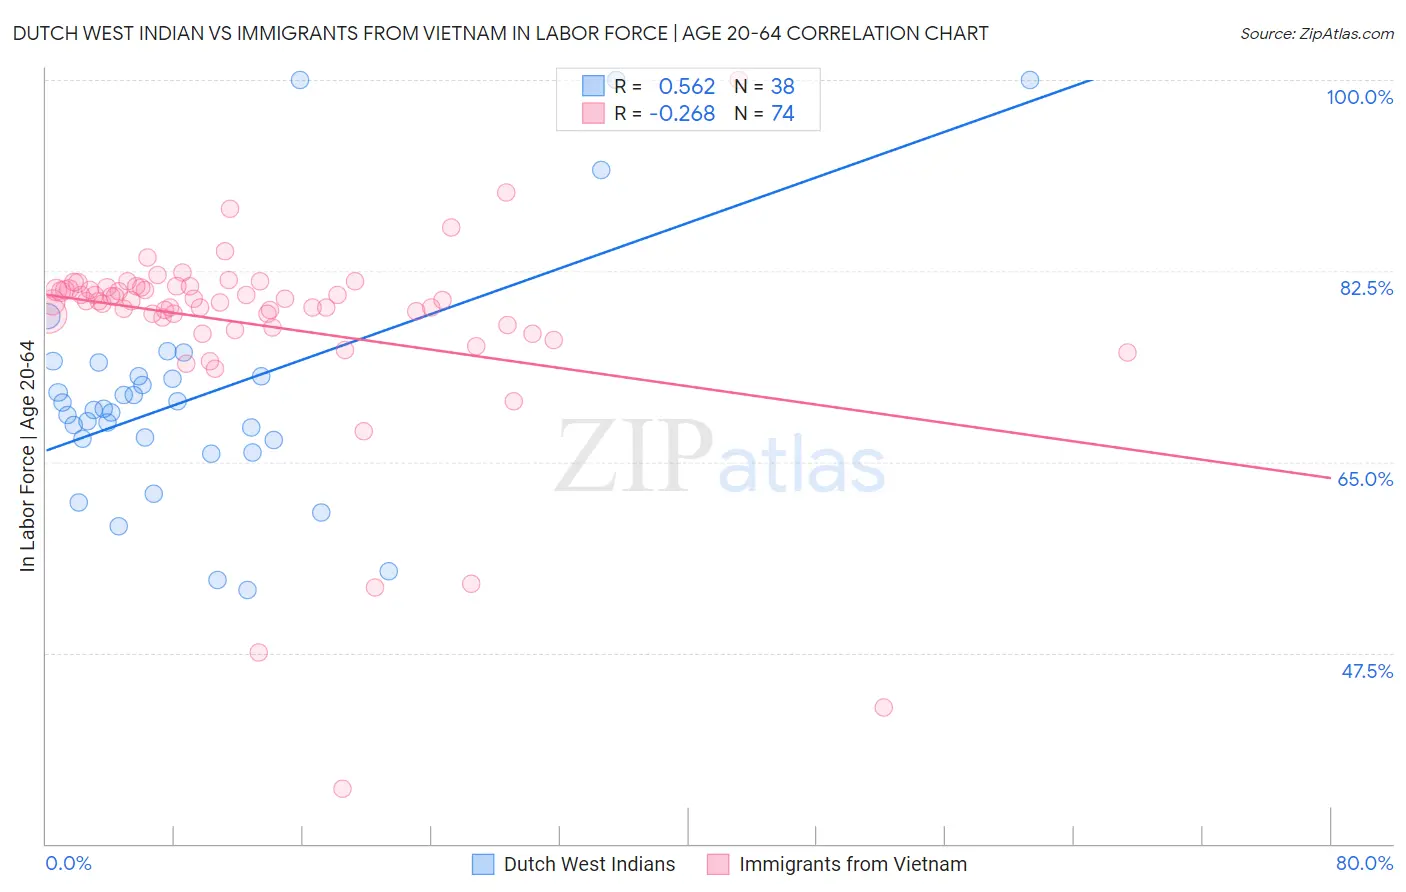
Dutch West Indian vs Immigrants from Vietnam In Labor Force | Age 20-64 Correlation Chart
The statistical analysis conducted on geographies consisting of 85,770,451 people shows a substantial positive correlation between the proportion of Dutch West Indians and labor force participation rate among population between the ages 20 and 64 in the United States with a correlation coefficient (R) of 0.562 and weighted average of 75.5%. Similarly, the statistical analysis conducted on geographies consisting of 404,837,038 people shows a weak negative correlation between the proportion of Immigrants from Vietnam and labor force participation rate among population between the ages 20 and 64 in the United States with a correlation coefficient (R) of -0.268 and weighted average of 80.0%, a difference of 5.9%.
In Labor Force | Age 20-64 Correlation Summary
| Measurement | Dutch West Indian | Immigrants from Vietnam |
| Minimum | 53.3% | 35.0% |
| Maximum | 100.0% | 100.0% |
| Range | 46.7% | 65.0% |
| Mean | 71.2% | 77.6% |
| Median | 69.9% | 79.7% |
| Interquartile 25% (IQ1) | 67.0% | 77.6% |
| Interquartile 75% (IQ3) | 72.9% | 81.0% |
| Interquartile Range (IQR) | 5.9% | 3.4% |
| Standard Deviation (Sample) | 11.0% | 9.5% |
| Standard Deviation (Population) | 10.9% | 9.4% |
Similar Demographics by In Labor Force | Age 20-64
Demographics Similar to Dutch West Indians by In Labor Force | Age 20-64
In terms of in labor force | age 20-64, the demographic groups most similar to Dutch West Indians are Cajun (75.5%, a difference of 0.040%), Seminole (75.5%, a difference of 0.050%), Choctaw (75.4%, a difference of 0.10%), Menominee (75.3%, a difference of 0.23%), and Yakama (75.8%, a difference of 0.40%).
| Demographics | Rating | Rank | In Labor Force | Age 20-64 |
| Ottawa | 0.0 /100 | #315 | Tragic 76.7% |
| Yaqui | 0.0 /100 | #316 | Tragic 76.5% |
| Cherokee | 0.0 /100 | #317 | Tragic 76.2% |
| Chickasaw | 0.0 /100 | #318 | Tragic 76.2% |
| Inupiat | 0.0 /100 | #319 | Tragic 76.1% |
| Yakama | 0.0 /100 | #320 | Tragic 75.8% |
| Seminole | 0.0 /100 | #321 | Tragic 75.5% |
| Dutch West Indians | 0.0 /100 | #322 | Tragic 75.5% |
| Cajuns | 0.0 /100 | #323 | Tragic 75.5% |
| Choctaw | 0.0 /100 | #324 | Tragic 75.4% |
| Menominee | 0.0 /100 | #325 | Tragic 75.3% |
| Creek | 0.0 /100 | #326 | Tragic 75.1% |
| Sioux | 0.0 /100 | #327 | Tragic 75.0% |
| Kiowa | 0.0 /100 | #328 | Tragic 75.0% |
| Cheyenne | 0.0 /100 | #329 | Tragic 74.8% |
Demographics Similar to Immigrants from Vietnam by In Labor Force | Age 20-64
In terms of in labor force | age 20-64, the demographic groups most similar to Immigrants from Vietnam are Cape Verdean (80.0%, a difference of 0.0%), Immigrants from Western Africa (80.0%, a difference of 0.010%), Immigrants from Taiwan (80.0%, a difference of 0.010%), Maltese (80.0%, a difference of 0.010%), and Immigrants from Kuwait (80.0%, a difference of 0.010%).
| Demographics | Rating | Rank | In Labor Force | Age 20-64 |
| Estonians | 94.0 /100 | #110 | Exceptional 80.0% |
| Immigrants | South America | 93.9 /100 | #111 | Exceptional 80.0% |
| Immigrants | Italy | 93.9 /100 | #112 | Exceptional 80.0% |
| Sri Lankans | 93.9 /100 | #113 | Exceptional 80.0% |
| Argentineans | 93.8 /100 | #114 | Exceptional 80.0% |
| Bermudans | 93.3 /100 | #115 | Exceptional 80.0% |
| Immigrants | Western Africa | 93.1 /100 | #116 | Exceptional 80.0% |
| Immigrants | Vietnam | 92.7 /100 | #117 | Exceptional 80.0% |
| Cape Verdeans | 92.7 /100 | #118 | Exceptional 80.0% |
| Immigrants | Taiwan | 92.5 /100 | #119 | Exceptional 80.0% |
| Maltese | 92.4 /100 | #120 | Exceptional 80.0% |
| Immigrants | Kuwait | 92.2 /100 | #121 | Exceptional 80.0% |
| Mongolians | 92.0 /100 | #122 | Exceptional 79.9% |
| Immigrants | Russia | 91.8 /100 | #123 | Exceptional 79.9% |
| Immigrants | Europe | 91.6 /100 | #124 | Exceptional 79.9% |