Dominican vs French In Labor Force | Age 30-34
COMPARE
Dominican
French
In Labor Force | Age 30-34
In Labor Force | Age 30-34 Comparison
Dominicans
French
83.8%
IN LABOR FORCE | AGE 30-34
0.2/ 100
METRIC RATING
262nd/ 347
METRIC RANK
84.4%
IN LABOR FORCE | AGE 30-34
13.8/ 100
METRIC RATING
205th/ 347
METRIC RANK
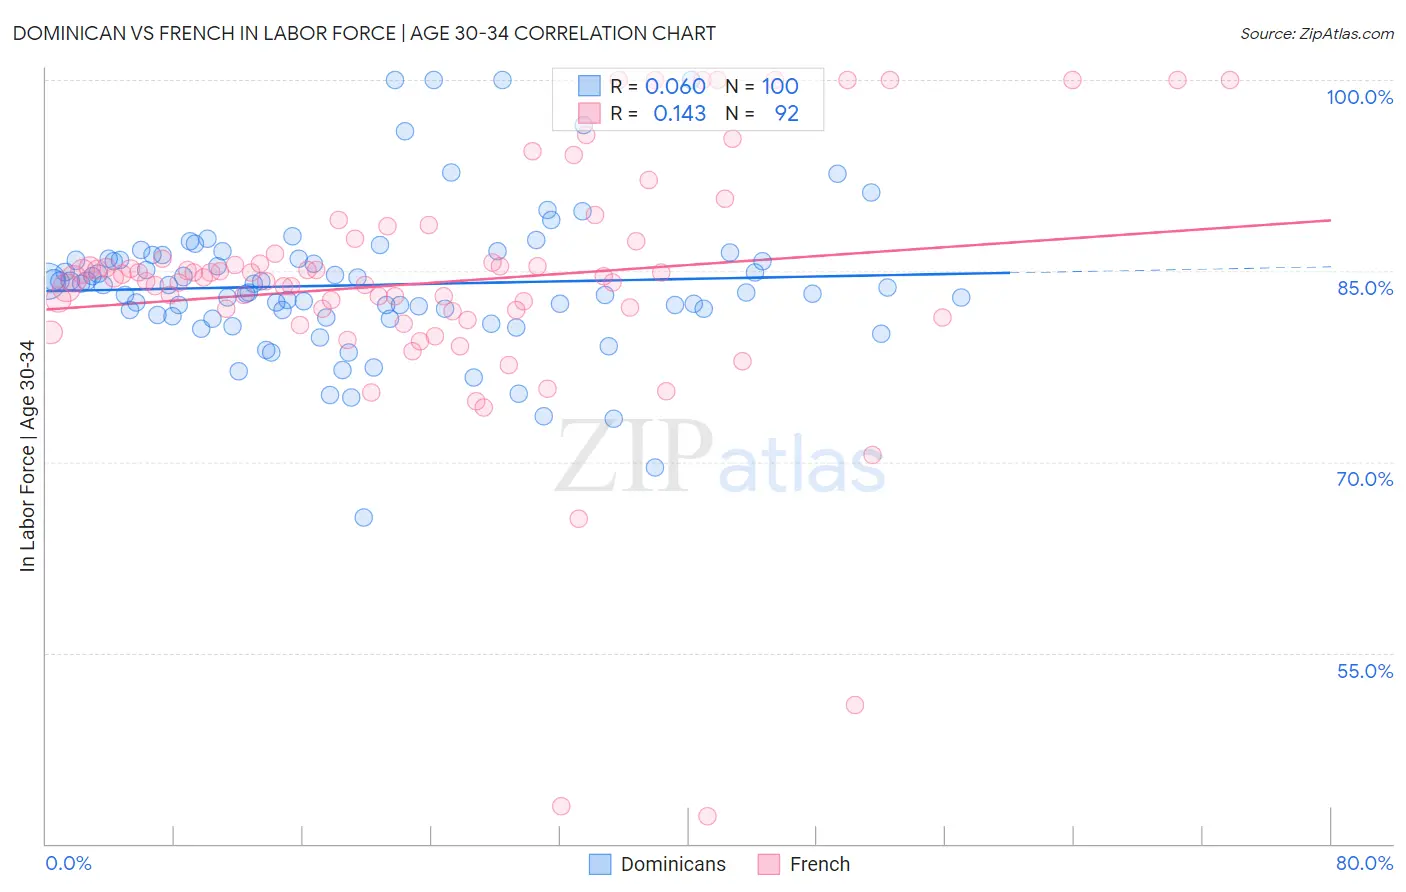
Dominican vs French In Labor Force | Age 30-34 Correlation Chart
The statistical analysis conducted on geographies consisting of 354,830,681 people shows a slight positive correlation between the proportion of Dominicans and labor force participation rate among population between the ages 30 and 34 in the United States with a correlation coefficient (R) of 0.060 and weighted average of 83.8%. Similarly, the statistical analysis conducted on geographies consisting of 571,091,805 people shows a poor positive correlation between the proportion of French and labor force participation rate among population between the ages 30 and 34 in the United States with a correlation coefficient (R) of 0.143 and weighted average of 84.4%, a difference of 0.76%.
In Labor Force | Age 30-34 Correlation Summary
| Measurement | Dominican | French |
| Minimum | 65.7% | 42.2% |
| Maximum | 100.0% | 100.0% |
| Range | 34.3% | 57.8% |
| Mean | 83.9% | 84.1% |
| Median | 83.8% | 84.5% |
| Interquartile 25% (IQ1) | 81.5% | 81.9% |
| Interquartile 75% (IQ3) | 85.9% | 86.2% |
| Interquartile Range (IQR) | 4.5% | 4.3% |
| Standard Deviation (Sample) | 5.7% | 10.0% |
| Standard Deviation (Population) | 5.7% | 9.9% |
Similar Demographics by In Labor Force | Age 30-34
Demographics Similar to Dominicans by In Labor Force | Age 30-34
In terms of in labor force | age 30-34, the demographic groups most similar to Dominicans are Immigrants from Guyana (83.8%, a difference of 0.0%), Immigrants from Dominican Republic (83.8%, a difference of 0.020%), Guyanese (83.8%, a difference of 0.020%), Honduran (83.8%, a difference of 0.040%), and Scotch-Irish (83.8%, a difference of 0.040%).
| Demographics | Rating | Rank | In Labor Force | Age 30-34 |
| Whites/Caucasians | 0.5 /100 | #255 | Tragic 83.9% |
| Immigrants | Lebanon | 0.4 /100 | #256 | Tragic 83.9% |
| Iraqis | 0.3 /100 | #257 | Tragic 83.8% |
| Hondurans | 0.3 /100 | #258 | Tragic 83.8% |
| Scotch-Irish | 0.3 /100 | #259 | Tragic 83.8% |
| Immigrants | Dominican Republic | 0.3 /100 | #260 | Tragic 83.8% |
| Guyanese | 0.3 /100 | #261 | Tragic 83.8% |
| Dominicans | 0.2 /100 | #262 | Tragic 83.8% |
| Immigrants | Guyana | 0.2 /100 | #263 | Tragic 83.8% |
| Guatemalans | 0.2 /100 | #264 | Tragic 83.7% |
| Immigrants | Honduras | 0.1 /100 | #265 | Tragic 83.7% |
| Immigrants | Guatemala | 0.1 /100 | #266 | Tragic 83.7% |
| Spaniards | 0.1 /100 | #267 | Tragic 83.6% |
| Immigrants | Bangladesh | 0.1 /100 | #268 | Tragic 83.6% |
| Vietnamese | 0.1 /100 | #269 | Tragic 83.6% |
Demographics Similar to French by In Labor Force | Age 30-34
In terms of in labor force | age 30-34, the demographic groups most similar to French are Ecuadorian (84.4%, a difference of 0.010%), Canadian (84.4%, a difference of 0.020%), Lebanese (84.4%, a difference of 0.050%), Trinidadian and Tobagonian (84.5%, a difference of 0.060%), and Immigrants from West Indies (84.5%, a difference of 0.060%).
| Demographics | Rating | Rank | In Labor Force | Age 30-34 |
| Dutch | 20.2 /100 | #198 | Fair 84.5% |
| Immigrants | Thailand | 19.1 /100 | #199 | Poor 84.5% |
| Sub-Saharan Africans | 19.0 /100 | #200 | Poor 84.5% |
| Trinidadians and Tobagonians | 18.2 /100 | #201 | Poor 84.5% |
| Immigrants | West Indies | 18.1 /100 | #202 | Poor 84.5% |
| Canadians | 15.4 /100 | #203 | Poor 84.4% |
| Ecuadorians | 14.2 /100 | #204 | Poor 84.4% |
| French | 13.8 /100 | #205 | Poor 84.4% |
| Lebanese | 10.6 /100 | #206 | Poor 84.4% |
| Bangladeshis | 9.4 /100 | #207 | Tragic 84.3% |
| Arabs | 8.9 /100 | #208 | Tragic 84.3% |
| Jamaicans | 8.8 /100 | #209 | Tragic 84.3% |
| Indonesians | 8.8 /100 | #210 | Tragic 84.3% |
| Japanese | 8.8 /100 | #211 | Tragic 84.3% |
| Immigrants | Western Asia | 8.2 /100 | #212 | Tragic 84.3% |