Dominican vs Moroccan In Labor Force | Age 30-34
COMPARE
Dominican
Moroccan
In Labor Force | Age 30-34
In Labor Force | Age 30-34 Comparison
Dominicans
Moroccans
83.8%
IN LABOR FORCE | AGE 30-34
0.2/ 100
METRIC RATING
262nd/ 347
METRIC RANK
84.6%
IN LABOR FORCE | AGE 30-34
40.3/ 100
METRIC RATING
181st/ 347
METRIC RANK
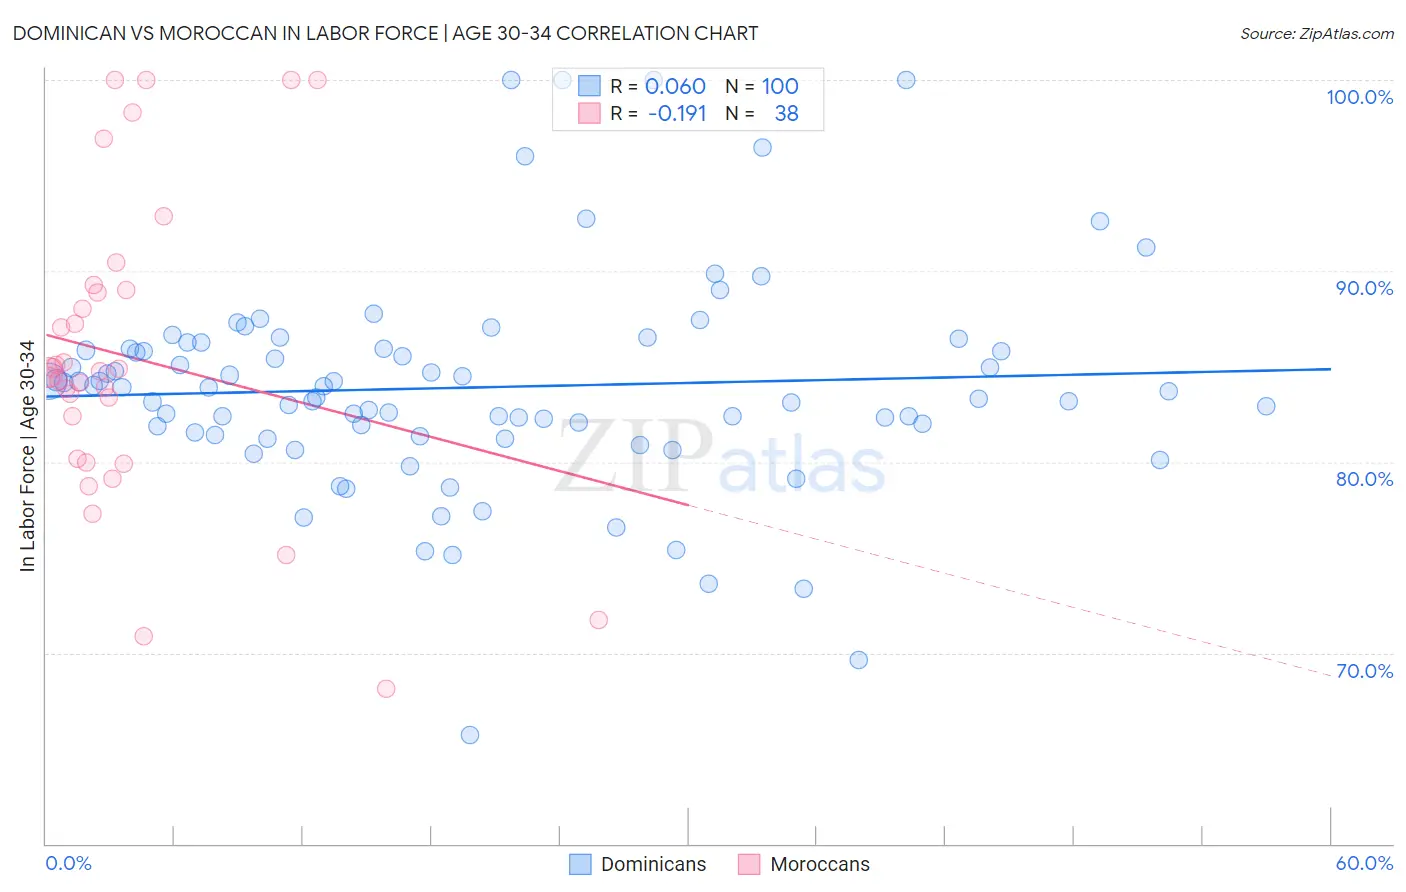
Dominican vs Moroccan In Labor Force | Age 30-34 Correlation Chart
The statistical analysis conducted on geographies consisting of 354,830,681 people shows a slight positive correlation between the proportion of Dominicans and labor force participation rate among population between the ages 30 and 34 in the United States with a correlation coefficient (R) of 0.060 and weighted average of 83.8%. Similarly, the statistical analysis conducted on geographies consisting of 201,755,147 people shows a poor negative correlation between the proportion of Moroccans and labor force participation rate among population between the ages 30 and 34 in the United States with a correlation coefficient (R) of -0.191 and weighted average of 84.6%, a difference of 1.0%.
In Labor Force | Age 30-34 Correlation Summary
| Measurement | Dominican | Moroccan |
| Minimum | 65.7% | 68.1% |
| Maximum | 100.0% | 100.0% |
| Range | 34.3% | 31.9% |
| Mean | 83.9% | 85.5% |
| Median | 83.8% | 84.7% |
| Interquartile 25% (IQ1) | 81.5% | 80.2% |
| Interquartile 75% (IQ3) | 85.9% | 89.0% |
| Interquartile Range (IQR) | 4.5% | 8.8% |
| Standard Deviation (Sample) | 5.7% | 8.0% |
| Standard Deviation (Population) | 5.7% | 7.9% |
Similar Demographics by In Labor Force | Age 30-34
Demographics Similar to Dominicans by In Labor Force | Age 30-34
In terms of in labor force | age 30-34, the demographic groups most similar to Dominicans are Immigrants from Guyana (83.8%, a difference of 0.0%), Immigrants from Dominican Republic (83.8%, a difference of 0.020%), Guyanese (83.8%, a difference of 0.020%), Honduran (83.8%, a difference of 0.040%), and Scotch-Irish (83.8%, a difference of 0.040%).
| Demographics | Rating | Rank | In Labor Force | Age 30-34 |
| Whites/Caucasians | 0.5 /100 | #255 | Tragic 83.9% |
| Immigrants | Lebanon | 0.4 /100 | #256 | Tragic 83.9% |
| Iraqis | 0.3 /100 | #257 | Tragic 83.8% |
| Hondurans | 0.3 /100 | #258 | Tragic 83.8% |
| Scotch-Irish | 0.3 /100 | #259 | Tragic 83.8% |
| Immigrants | Dominican Republic | 0.3 /100 | #260 | Tragic 83.8% |
| Guyanese | 0.3 /100 | #261 | Tragic 83.8% |
| Dominicans | 0.2 /100 | #262 | Tragic 83.8% |
| Immigrants | Guyana | 0.2 /100 | #263 | Tragic 83.8% |
| Guatemalans | 0.2 /100 | #264 | Tragic 83.7% |
| Immigrants | Honduras | 0.1 /100 | #265 | Tragic 83.7% |
| Immigrants | Guatemala | 0.1 /100 | #266 | Tragic 83.7% |
| Spaniards | 0.1 /100 | #267 | Tragic 83.6% |
| Immigrants | Bangladesh | 0.1 /100 | #268 | Tragic 83.6% |
| Vietnamese | 0.1 /100 | #269 | Tragic 83.6% |
Demographics Similar to Moroccans by In Labor Force | Age 30-34
In terms of in labor force | age 30-34, the demographic groups most similar to Moroccans are Immigrants from Netherlands (84.6%, a difference of 0.010%), Immigrants from Nigeria (84.6%, a difference of 0.020%), Okinawan (84.6%, a difference of 0.030%), Barbadian (84.6%, a difference of 0.030%), and Immigrants from Canada (84.6%, a difference of 0.040%).
| Demographics | Rating | Rank | In Labor Force | Age 30-34 |
| Finns | 50.0 /100 | #174 | Average 84.7% |
| Immigrants | South America | 50.0 /100 | #175 | Average 84.7% |
| Immigrants | Uzbekistan | 49.1 /100 | #176 | Average 84.7% |
| Laotians | 46.9 /100 | #177 | Average 84.7% |
| Okinawans | 44.1 /100 | #178 | Average 84.6% |
| Immigrants | Nigeria | 42.5 /100 | #179 | Average 84.6% |
| Immigrants | Netherlands | 42.1 /100 | #180 | Average 84.6% |
| Moroccans | 40.3 /100 | #181 | Average 84.6% |
| Barbadians | 36.7 /100 | #182 | Fair 84.6% |
| Immigrants | Canada | 35.0 /100 | #183 | Fair 84.6% |
| Immigrants | North America | 33.3 /100 | #184 | Fair 84.6% |
| Immigrants | Philippines | 31.5 /100 | #185 | Fair 84.6% |
| Immigrants | Congo | 29.7 /100 | #186 | Fair 84.6% |
| Costa Ricans | 29.6 /100 | #187 | Fair 84.6% |
| Taiwanese | 29.4 /100 | #188 | Fair 84.6% |