Dominican vs Croatian In Labor Force | Age 30-34
COMPARE
Dominican
Croatian
In Labor Force | Age 30-34
In Labor Force | Age 30-34 Comparison
Dominicans
Croatians
83.8%
IN LABOR FORCE | AGE 30-34
0.2/ 100
METRIC RATING
262nd/ 347
METRIC RANK
85.6%
IN LABOR FORCE | AGE 30-34
99.8/ 100
METRIC RATING
47th/ 347
METRIC RANK
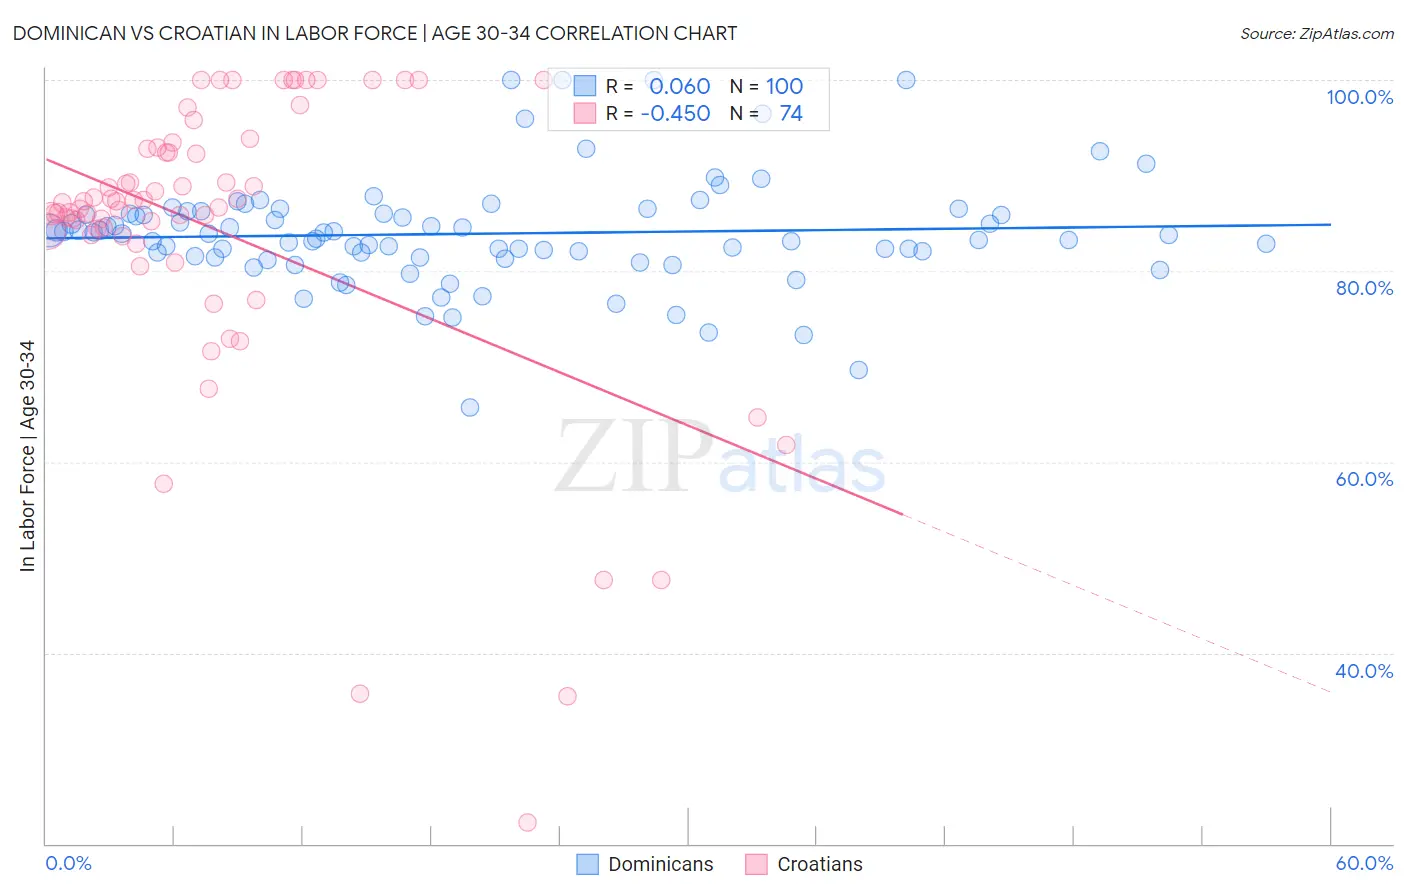
Dominican vs Croatian In Labor Force | Age 30-34 Correlation Chart
The statistical analysis conducted on geographies consisting of 354,830,681 people shows a slight positive correlation between the proportion of Dominicans and labor force participation rate among population between the ages 30 and 34 in the United States with a correlation coefficient (R) of 0.060 and weighted average of 83.8%. Similarly, the statistical analysis conducted on geographies consisting of 375,472,504 people shows a moderate negative correlation between the proportion of Croatians and labor force participation rate among population between the ages 30 and 34 in the United States with a correlation coefficient (R) of -0.450 and weighted average of 85.6%, a difference of 2.2%.
In Labor Force | Age 30-34 Correlation Summary
| Measurement | Dominican | Croatian |
| Minimum | 65.7% | 22.2% |
| Maximum | 100.0% | 100.0% |
| Range | 34.3% | 77.8% |
| Mean | 83.9% | 84.1% |
| Median | 83.8% | 86.9% |
| Interquartile 25% (IQ1) | 81.5% | 83.7% |
| Interquartile 75% (IQ3) | 85.9% | 92.8% |
| Interquartile Range (IQR) | 4.5% | 9.0% |
| Standard Deviation (Sample) | 5.7% | 15.7% |
| Standard Deviation (Population) | 5.7% | 15.6% |
Similar Demographics by In Labor Force | Age 30-34
Demographics Similar to Dominicans by In Labor Force | Age 30-34
In terms of in labor force | age 30-34, the demographic groups most similar to Dominicans are Immigrants from Guyana (83.8%, a difference of 0.0%), Immigrants from Dominican Republic (83.8%, a difference of 0.020%), Guyanese (83.8%, a difference of 0.020%), Honduran (83.8%, a difference of 0.040%), and Scotch-Irish (83.8%, a difference of 0.040%).
| Demographics | Rating | Rank | In Labor Force | Age 30-34 |
| Whites/Caucasians | 0.5 /100 | #255 | Tragic 83.9% |
| Immigrants | Lebanon | 0.4 /100 | #256 | Tragic 83.9% |
| Iraqis | 0.3 /100 | #257 | Tragic 83.8% |
| Hondurans | 0.3 /100 | #258 | Tragic 83.8% |
| Scotch-Irish | 0.3 /100 | #259 | Tragic 83.8% |
| Immigrants | Dominican Republic | 0.3 /100 | #260 | Tragic 83.8% |
| Guyanese | 0.3 /100 | #261 | Tragic 83.8% |
| Dominicans | 0.2 /100 | #262 | Tragic 83.8% |
| Immigrants | Guyana | 0.2 /100 | #263 | Tragic 83.8% |
| Guatemalans | 0.2 /100 | #264 | Tragic 83.7% |
| Immigrants | Honduras | 0.1 /100 | #265 | Tragic 83.7% |
| Immigrants | Guatemala | 0.1 /100 | #266 | Tragic 83.7% |
| Spaniards | 0.1 /100 | #267 | Tragic 83.6% |
| Immigrants | Bangladesh | 0.1 /100 | #268 | Tragic 83.6% |
| Vietnamese | 0.1 /100 | #269 | Tragic 83.6% |
Demographics Similar to Croatians by In Labor Force | Age 30-34
In terms of in labor force | age 30-34, the demographic groups most similar to Croatians are Immigrants from Morocco (85.6%, a difference of 0.0%), Immigrants from Sri Lanka (85.6%, a difference of 0.010%), Immigrants from Nepal (85.6%, a difference of 0.010%), Immigrants from Sweden (85.6%, a difference of 0.020%), and Lithuanian (85.6%, a difference of 0.020%).
| Demographics | Rating | Rank | In Labor Force | Age 30-34 |
| Turks | 99.9 /100 | #40 | Exceptional 85.7% |
| Immigrants | Italy | 99.9 /100 | #41 | Exceptional 85.7% |
| Zimbabweans | 99.8 /100 | #42 | Exceptional 85.6% |
| Immigrants | Lithuania | 99.8 /100 | #43 | Exceptional 85.6% |
| Immigrants | Sri Lanka | 99.8 /100 | #44 | Exceptional 85.6% |
| Immigrants | Nepal | 99.8 /100 | #45 | Exceptional 85.6% |
| Immigrants | Morocco | 99.8 /100 | #46 | Exceptional 85.6% |
| Croatians | 99.8 /100 | #47 | Exceptional 85.6% |
| Immigrants | Sweden | 99.8 /100 | #48 | Exceptional 85.6% |
| Lithuanians | 99.8 /100 | #49 | Exceptional 85.6% |
| Immigrants | Australia | 99.8 /100 | #50 | Exceptional 85.6% |
| Cape Verdeans | 99.7 /100 | #51 | Exceptional 85.6% |
| Slovenes | 99.7 /100 | #52 | Exceptional 85.6% |
| Filipinos | 99.6 /100 | #53 | Exceptional 85.5% |
| Immigrants | Kenya | 99.6 /100 | #54 | Exceptional 85.5% |