Delaware vs Ecuadorian In Labor Force | Age 20-24
COMPARE
Delaware
Ecuadorian
In Labor Force | Age 20-24
In Labor Force | Age 20-24 Comparison
Delaware
Ecuadorians
75.5%
IN LABOR FORCE | AGE 20-24
84.5/ 100
METRIC RATING
140th/ 347
METRIC RANK
72.4%
IN LABOR FORCE | AGE 20-24
0.0/ 100
METRIC RATING
303rd/ 347
METRIC RANK
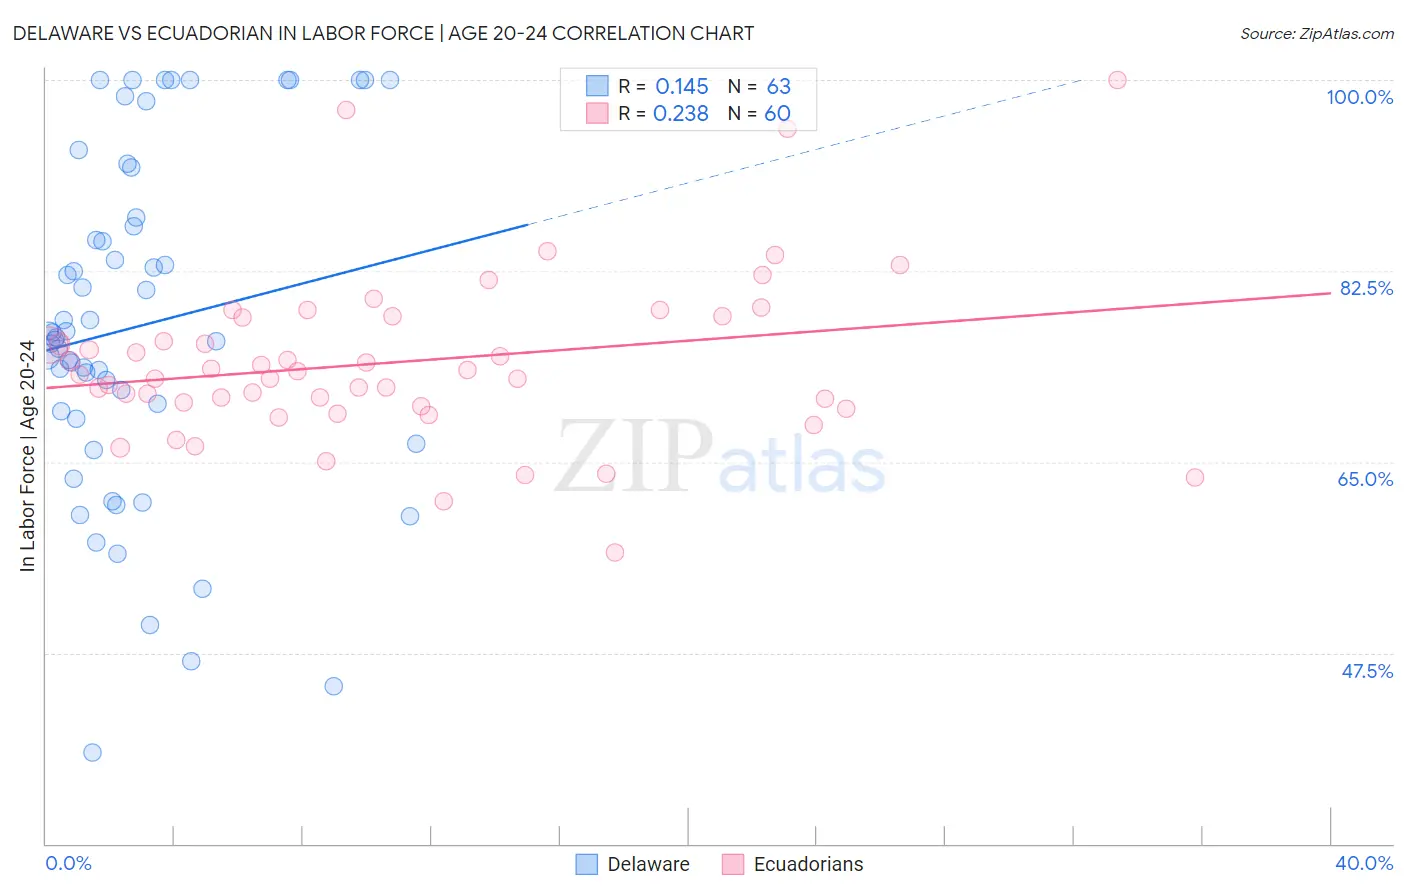
Delaware vs Ecuadorian In Labor Force | Age 20-24 Correlation Chart
The statistical analysis conducted on geographies consisting of 96,225,060 people shows a poor positive correlation between the proportion of Delaware and labor force participation rate among population between the ages 20 and 24 in the United States with a correlation coefficient (R) of 0.145 and weighted average of 75.5%. Similarly, the statistical analysis conducted on geographies consisting of 317,809,827 people shows a weak positive correlation between the proportion of Ecuadorians and labor force participation rate among population between the ages 20 and 24 in the United States with a correlation coefficient (R) of 0.238 and weighted average of 72.4%, a difference of 4.3%.
In Labor Force | Age 20-24 Correlation Summary
| Measurement | Delaware | Ecuadorian |
| Minimum | 38.4% | 56.7% |
| Maximum | 100.0% | 100.0% |
| Range | 61.6% | 43.3% |
| Mean | 77.4% | 74.2% |
| Median | 76.4% | 73.1% |
| Interquartile 25% (IQ1) | 69.0% | 70.2% |
| Interquartile 75% (IQ3) | 87.4% | 78.2% |
| Interquartile Range (IQR) | 18.4% | 8.0% |
| Standard Deviation (Sample) | 15.6% | 7.7% |
| Standard Deviation (Population) | 15.4% | 7.7% |
Similar Demographics by In Labor Force | Age 20-24
Demographics Similar to Delaware by In Labor Force | Age 20-24
In terms of in labor force | age 20-24, the demographic groups most similar to Delaware are Immigrants from England (75.5%, a difference of 0.0%), Immigrants from Brazil (75.5%, a difference of 0.010%), Jordanian (75.5%, a difference of 0.010%), Australian (75.5%, a difference of 0.010%), and Romanian (75.5%, a difference of 0.010%).
| Demographics | Rating | Rank | In Labor Force | Age 20-24 |
| Zimbabweans | 88.2 /100 | #133 | Excellent 75.6% |
| Estonians | 87.1 /100 | #134 | Excellent 75.6% |
| Yaqui | 85.5 /100 | #135 | Excellent 75.5% |
| Immigrants | Brazil | 84.8 /100 | #136 | Excellent 75.5% |
| Jordanians | 84.8 /100 | #137 | Excellent 75.5% |
| Australians | 84.8 /100 | #138 | Excellent 75.5% |
| Immigrants | England | 84.6 /100 | #139 | Excellent 75.5% |
| Delaware | 84.5 /100 | #140 | Excellent 75.5% |
| Romanians | 84.1 /100 | #141 | Excellent 75.5% |
| Blackfeet | 83.6 /100 | #142 | Excellent 75.5% |
| Spaniards | 82.0 /100 | #143 | Excellent 75.5% |
| Bhutanese | 80.8 /100 | #144 | Excellent 75.4% |
| Koreans | 79.7 /100 | #145 | Good 75.4% |
| Mexican American Indians | 78.8 /100 | #146 | Good 75.4% |
| Comanche | 77.6 /100 | #147 | Good 75.4% |
Demographics Similar to Ecuadorians by In Labor Force | Age 20-24
In terms of in labor force | age 20-24, the demographic groups most similar to Ecuadorians are Native/Alaskan (72.4%, a difference of 0.010%), Immigrants from West Indies (72.4%, a difference of 0.010%), Immigrants from Singapore (72.4%, a difference of 0.040%), Immigrants from Jamaica (72.4%, a difference of 0.060%), and Cuban (72.5%, a difference of 0.10%).
| Demographics | Rating | Rank | In Labor Force | Age 20-24 |
| Jamaicans | 0.0 /100 | #296 | Tragic 72.7% |
| Central American Indians | 0.0 /100 | #297 | Tragic 72.7% |
| Israelis | 0.0 /100 | #298 | Tragic 72.6% |
| Iranians | 0.0 /100 | #299 | Tragic 72.6% |
| Armenians | 0.0 /100 | #300 | Tragic 72.5% |
| Cubans | 0.0 /100 | #301 | Tragic 72.5% |
| Natives/Alaskans | 0.0 /100 | #302 | Tragic 72.4% |
| Ecuadorians | 0.0 /100 | #303 | Tragic 72.4% |
| Immigrants | West Indies | 0.0 /100 | #304 | Tragic 72.4% |
| Immigrants | Singapore | 0.0 /100 | #305 | Tragic 72.4% |
| Immigrants | Jamaica | 0.0 /100 | #306 | Tragic 72.4% |
| Immigrants | Ecuador | 0.0 /100 | #307 | Tragic 72.3% |
| Soviet Union | 0.0 /100 | #308 | Tragic 72.3% |
| Tsimshian | 0.0 /100 | #309 | Tragic 72.3% |
| Immigrants | Cuba | 0.0 /100 | #310 | Tragic 72.0% |