Delaware vs Immigrants from Ireland In Labor Force | Age 30-34
COMPARE
Delaware
Immigrants from Ireland
In Labor Force | Age 30-34
In Labor Force | Age 30-34 Comparison
Delaware
Immigrants from Ireland
83.5%
IN LABOR FORCE | AGE 30-34
0.0/ 100
METRIC RATING
277th/ 347
METRIC RANK
86.3%
IN LABOR FORCE | AGE 30-34
100.0/ 100
METRIC RATING
5th/ 347
METRIC RANK
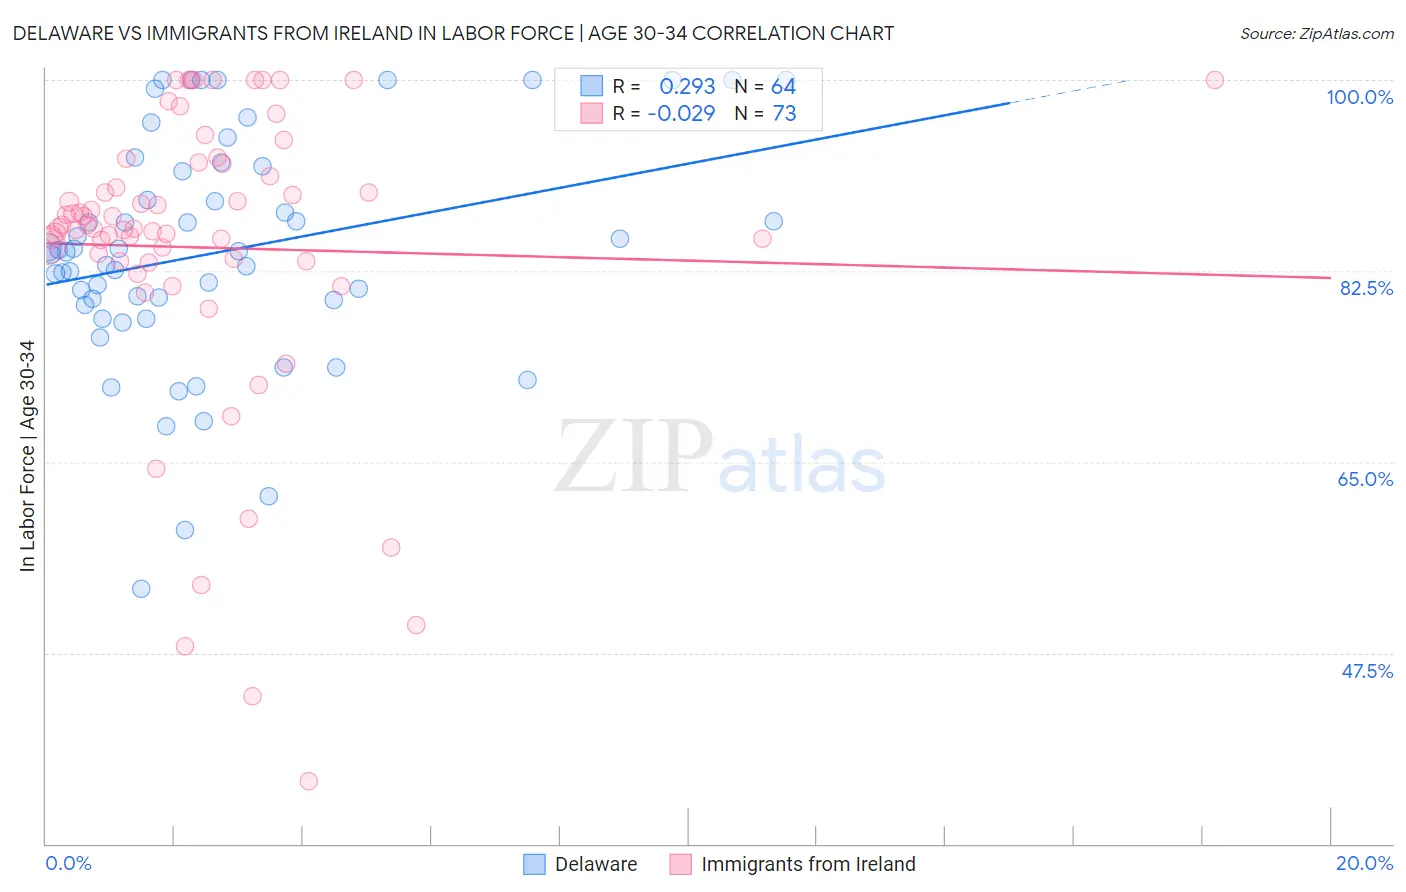
Delaware vs Immigrants from Ireland In Labor Force | Age 30-34 Correlation Chart
The statistical analysis conducted on geographies consisting of 96,207,196 people shows a weak positive correlation between the proportion of Delaware and labor force participation rate among population between the ages 30 and 34 in the United States with a correlation coefficient (R) of 0.293 and weighted average of 83.5%. Similarly, the statistical analysis conducted on geographies consisting of 240,718,407 people shows no correlation between the proportion of Immigrants from Ireland and labor force participation rate among population between the ages 30 and 34 in the United States with a correlation coefficient (R) of -0.029 and weighted average of 86.3%, a difference of 3.4%.
In Labor Force | Age 30-34 Correlation Summary
| Measurement | Delaware | Immigrants from Ireland |
| Minimum | 53.3% | 35.7% |
| Maximum | 100.0% | 100.0% |
| Range | 46.7% | 64.3% |
| Mean | 84.3% | 84.6% |
| Median | 84.3% | 86.5% |
| Interquartile 25% (IQ1) | 79.6% | 83.4% |
| Interquartile 75% (IQ3) | 91.8% | 92.4% |
| Interquartile Range (IQR) | 12.3% | 8.9% |
| Standard Deviation (Sample) | 10.5% | 13.7% |
| Standard Deviation (Population) | 10.4% | 13.6% |
Similar Demographics by In Labor Force | Age 30-34
Demographics Similar to Delaware by In Labor Force | Age 30-34
In terms of in labor force | age 30-34, the demographic groups most similar to Delaware are Tongan (83.5%, a difference of 0.020%), Belizean (83.5%, a difference of 0.030%), Immigrants from Grenada (83.5%, a difference of 0.030%), Guamanian/Chamorro (83.5%, a difference of 0.040%), and Fijian (83.4%, a difference of 0.050%).
| Demographics | Rating | Rank | In Labor Force | Age 30-34 |
| Spanish Americans | 0.0 /100 | #270 | Tragic 83.5% |
| Spanish | 0.0 /100 | #271 | Tragic 83.5% |
| Immigrants | Nonimmigrants | 0.0 /100 | #272 | Tragic 83.5% |
| Guamanians/Chamorros | 0.0 /100 | #273 | Tragic 83.5% |
| Belizeans | 0.0 /100 | #274 | Tragic 83.5% |
| Immigrants | Grenada | 0.0 /100 | #275 | Tragic 83.5% |
| Tongans | 0.0 /100 | #276 | Tragic 83.5% |
| Delaware | 0.0 /100 | #277 | Tragic 83.5% |
| Fijians | 0.0 /100 | #278 | Tragic 83.4% |
| Immigrants | Fiji | 0.0 /100 | #279 | Tragic 83.4% |
| Africans | 0.0 /100 | #280 | Tragic 83.4% |
| Samoans | 0.0 /100 | #281 | Tragic 83.3% |
| Mexican American Indians | 0.0 /100 | #282 | Tragic 83.2% |
| Assyrians/Chaldeans/Syriacs | 0.0 /100 | #283 | Tragic 83.2% |
| Immigrants | Belize | 0.0 /100 | #284 | Tragic 83.2% |
Demographics Similar to Immigrants from Ireland by In Labor Force | Age 30-34
In terms of in labor force | age 30-34, the demographic groups most similar to Immigrants from Ireland are Somali (86.2%, a difference of 0.030%), Immigrants from Bolivia (86.2%, a difference of 0.040%), Cambodian (86.2%, a difference of 0.060%), Immigrants from Somalia (86.2%, a difference of 0.070%), and Immigrants from Serbia (86.2%, a difference of 0.10%).
| Demographics | Rating | Rank | In Labor Force | Age 30-34 |
| Luxembourgers | 100.0 /100 | #1 | Exceptional 86.6% |
| Ethiopians | 100.0 /100 | #2 | Exceptional 86.6% |
| Immigrants | Ethiopia | 100.0 /100 | #3 | Exceptional 86.6% |
| Liberians | 100.0 /100 | #4 | Exceptional 86.4% |
| Immigrants | Ireland | 100.0 /100 | #5 | Exceptional 86.3% |
| Somalis | 100.0 /100 | #6 | Exceptional 86.2% |
| Immigrants | Bolivia | 100.0 /100 | #7 | Exceptional 86.2% |
| Cambodians | 100.0 /100 | #8 | Exceptional 86.2% |
| Immigrants | Somalia | 100.0 /100 | #9 | Exceptional 86.2% |
| Immigrants | Serbia | 100.0 /100 | #10 | Exceptional 86.2% |
| Carpatho Rusyns | 100.0 /100 | #11 | Exceptional 86.2% |
| Bolivians | 100.0 /100 | #12 | Exceptional 86.1% |
| Immigrants | Croatia | 100.0 /100 | #13 | Exceptional 86.1% |
| Immigrants | Cabo Verde | 100.0 /100 | #14 | Exceptional 86.1% |
| Immigrants | Albania | 100.0 /100 | #15 | Exceptional 86.1% |