Delaware vs Immigrants from Guyana In Labor Force | Age 30-34
COMPARE
Delaware
Immigrants from Guyana
In Labor Force | Age 30-34
In Labor Force | Age 30-34 Comparison
Delaware
Immigrants from Guyana
83.5%
IN LABOR FORCE | AGE 30-34
0.0/ 100
METRIC RATING
277th/ 347
METRIC RANK
83.8%
IN LABOR FORCE | AGE 30-34
0.2/ 100
METRIC RATING
263rd/ 347
METRIC RANK
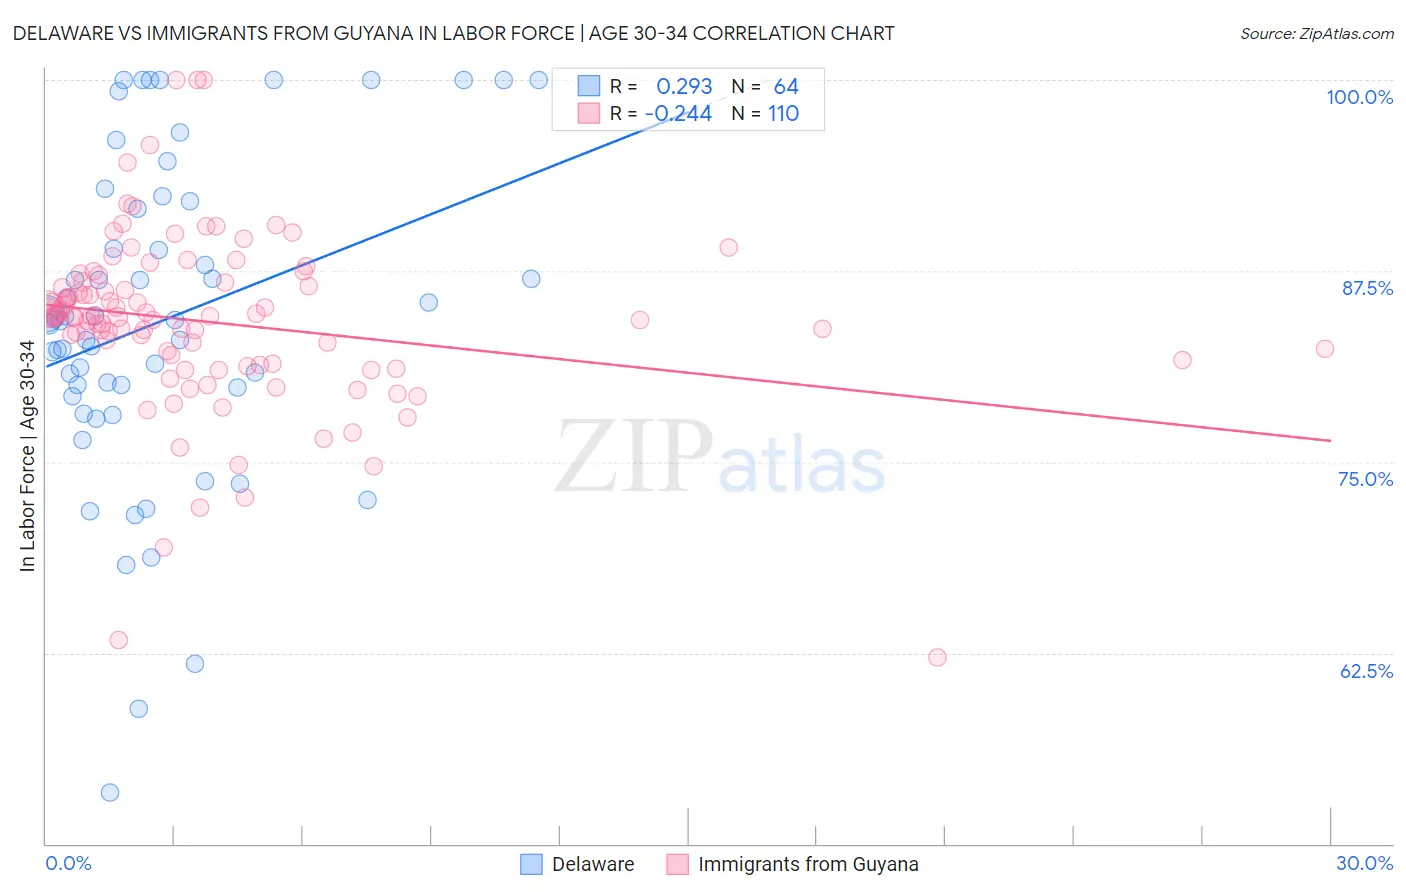
Delaware vs Immigrants from Guyana In Labor Force | Age 30-34 Correlation Chart
The statistical analysis conducted on geographies consisting of 96,207,196 people shows a weak positive correlation between the proportion of Delaware and labor force participation rate among population between the ages 30 and 34 in the United States with a correlation coefficient (R) of 0.293 and weighted average of 83.5%. Similarly, the statistical analysis conducted on geographies consisting of 183,640,015 people shows a weak negative correlation between the proportion of Immigrants from Guyana and labor force participation rate among population between the ages 30 and 34 in the United States with a correlation coefficient (R) of -0.244 and weighted average of 83.8%, a difference of 0.38%.
In Labor Force | Age 30-34 Correlation Summary
| Measurement | Delaware | Immigrants from Guyana |
| Minimum | 53.3% | 62.2% |
| Maximum | 100.0% | 100.0% |
| Range | 46.7% | 37.8% |
| Mean | 84.3% | 84.1% |
| Median | 84.3% | 84.5% |
| Interquartile 25% (IQ1) | 79.6% | 81.4% |
| Interquartile 75% (IQ3) | 91.8% | 86.8% |
| Interquartile Range (IQR) | 12.3% | 5.4% |
| Standard Deviation (Sample) | 10.5% | 5.9% |
| Standard Deviation (Population) | 10.4% | 5.8% |
Demographics Similar to Delaware and Immigrants from Guyana by In Labor Force | Age 30-34
In terms of in labor force | age 30-34, the demographic groups most similar to Delaware are Tongan (83.5%, a difference of 0.020%), Belizean (83.5%, a difference of 0.030%), Immigrants from Grenada (83.5%, a difference of 0.030%), Guamanian/Chamorro (83.5%, a difference of 0.040%), and Fijian (83.4%, a difference of 0.050%). Similarly, the demographic groups most similar to Immigrants from Guyana are Dominican (83.8%, a difference of 0.0%), Guyanese (83.8%, a difference of 0.020%), Immigrants from Dominican Republic (83.8%, a difference of 0.030%), Guatemalan (83.7%, a difference of 0.050%), and Immigrants from Honduras (83.7%, a difference of 0.080%).
| Demographics | Rating | Rank | In Labor Force | Age 30-34 |
| Immigrants | Dominican Republic | 0.3 /100 | #260 | Tragic 83.8% |
| Guyanese | 0.3 /100 | #261 | Tragic 83.8% |
| Dominicans | 0.2 /100 | #262 | Tragic 83.8% |
| Immigrants | Guyana | 0.2 /100 | #263 | Tragic 83.8% |
| Guatemalans | 0.2 /100 | #264 | Tragic 83.7% |
| Immigrants | Honduras | 0.1 /100 | #265 | Tragic 83.7% |
| Immigrants | Guatemala | 0.1 /100 | #266 | Tragic 83.7% |
| Spaniards | 0.1 /100 | #267 | Tragic 83.6% |
| Immigrants | Bangladesh | 0.1 /100 | #268 | Tragic 83.6% |
| Vietnamese | 0.1 /100 | #269 | Tragic 83.6% |
| Spanish Americans | 0.0 /100 | #270 | Tragic 83.5% |
| Spanish | 0.0 /100 | #271 | Tragic 83.5% |
| Immigrants | Nonimmigrants | 0.0 /100 | #272 | Tragic 83.5% |
| Guamanians/Chamorros | 0.0 /100 | #273 | Tragic 83.5% |
| Belizeans | 0.0 /100 | #274 | Tragic 83.5% |
| Immigrants | Grenada | 0.0 /100 | #275 | Tragic 83.5% |
| Tongans | 0.0 /100 | #276 | Tragic 83.5% |
| Delaware | 0.0 /100 | #277 | Tragic 83.5% |
| Fijians | 0.0 /100 | #278 | Tragic 83.4% |
| Immigrants | Fiji | 0.0 /100 | #279 | Tragic 83.4% |
| Africans | 0.0 /100 | #280 | Tragic 83.4% |