Danish vs Latvian In Labor Force | Age 16-19
COMPARE
Danish
Latvian
In Labor Force | Age 16-19
In Labor Force | Age 16-19 Comparison
Danes
Latvians
44.7%
IN LABOR FORCE | AGE 16-19
100.0/ 100
METRIC RATING
7th/ 347
METRIC RANK
38.9%
IN LABOR FORCE | AGE 16-19
99.4/ 100
METRIC RATING
96th/ 347
METRIC RANK
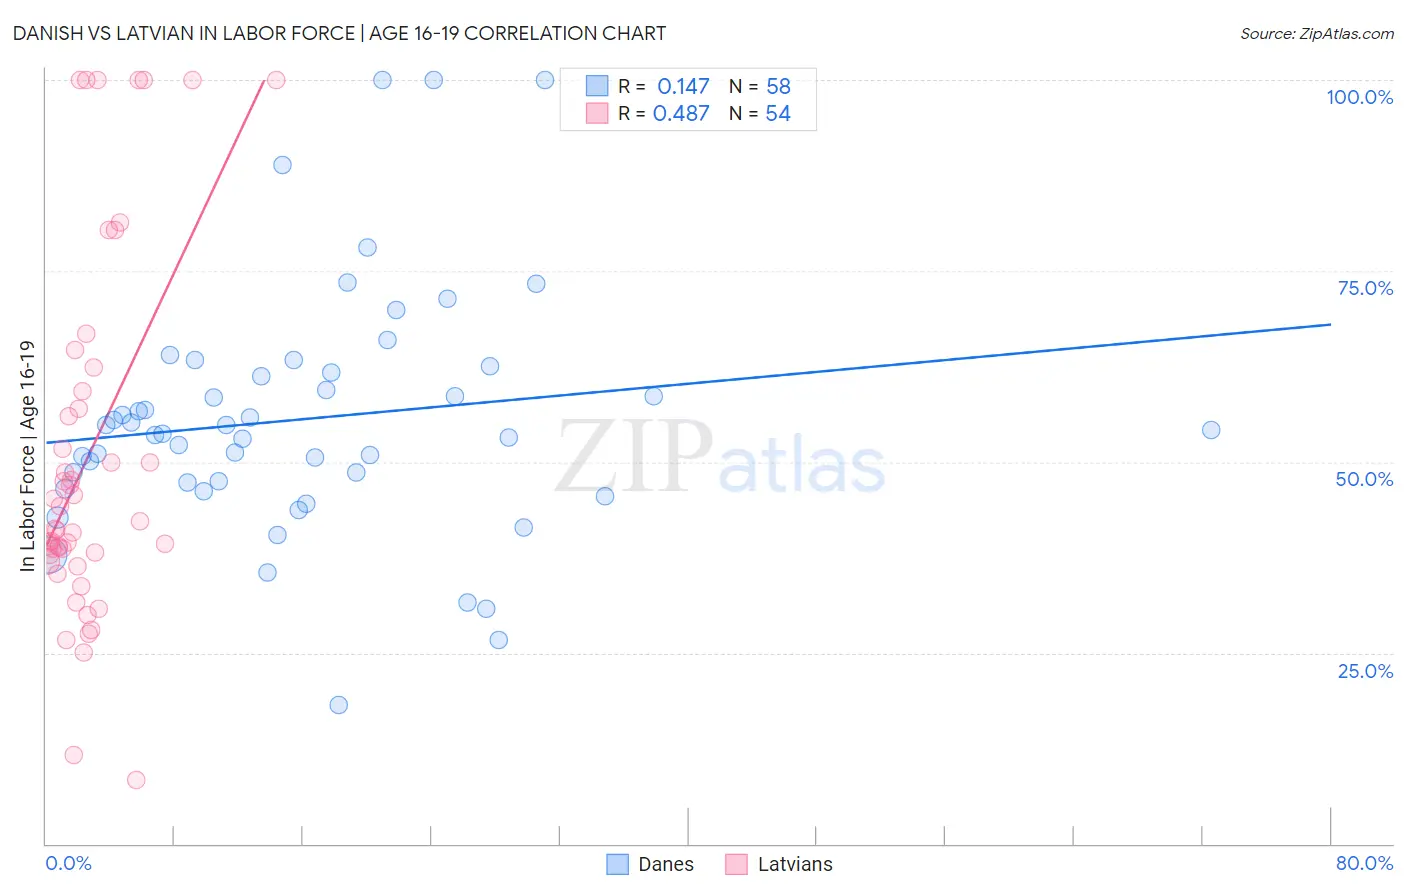
Danish vs Latvian In Labor Force | Age 16-19 Correlation Chart
The statistical analysis conducted on geographies consisting of 472,554,362 people shows a poor positive correlation between the proportion of Danes and labor force participation rate among population between the ages 16 and 19 in the United States with a correlation coefficient (R) of 0.147 and weighted average of 44.7%. Similarly, the statistical analysis conducted on geographies consisting of 220,454,154 people shows a moderate positive correlation between the proportion of Latvians and labor force participation rate among population between the ages 16 and 19 in the United States with a correlation coefficient (R) of 0.487 and weighted average of 38.9%, a difference of 14.9%.
In Labor Force | Age 16-19 Correlation Summary
| Measurement | Danish | Latvian |
| Minimum | 18.2% | 8.4% |
| Maximum | 100.0% | 100.0% |
| Range | 81.8% | 91.6% |
| Mean | 55.6% | 50.8% |
| Median | 53.9% | 41.8% |
| Interquartile 25% (IQ1) | 47.3% | 37.8% |
| Interquartile 75% (IQ3) | 61.7% | 59.2% |
| Interquartile Range (IQR) | 14.4% | 21.4% |
| Standard Deviation (Sample) | 16.1% | 23.9% |
| Standard Deviation (Population) | 16.0% | 23.6% |
Similar Demographics by In Labor Force | Age 16-19
Demographics Similar to Danes by In Labor Force | Age 16-19
In terms of in labor force | age 16-19, the demographic groups most similar to Danes are Immigrants from Cabo Verde (44.7%, a difference of 0.040%), Cape Verdean (44.5%, a difference of 0.46%), Somali (45.1%, a difference of 0.95%), Alaskan Athabascan (45.2%, a difference of 1.1%), and German (44.2%, a difference of 1.2%).
| Demographics | Rating | Rank | In Labor Force | Age 16-19 |
| Pennsylvania Germans | 100.0 /100 | #1 | Exceptional 46.4% |
| Norwegians | 100.0 /100 | #2 | Exceptional 46.2% |
| Immigrants | Somalia | 100.0 /100 | #3 | Exceptional 45.6% |
| Luxembourgers | 100.0 /100 | #4 | Exceptional 45.3% |
| Alaskan Athabascans | 100.0 /100 | #5 | Exceptional 45.2% |
| Somalis | 100.0 /100 | #6 | Exceptional 45.1% |
| Danes | 100.0 /100 | #7 | Exceptional 44.7% |
| Immigrants | Cabo Verde | 100.0 /100 | #8 | Exceptional 44.7% |
| Cape Verdeans | 100.0 /100 | #9 | Exceptional 44.5% |
| Germans | 100.0 /100 | #10 | Exceptional 44.2% |
| Swedes | 100.0 /100 | #11 | Exceptional 44.1% |
| Finns | 100.0 /100 | #12 | Exceptional 43.9% |
| Dutch | 100.0 /100 | #13 | Exceptional 43.8% |
| Chippewa | 100.0 /100 | #14 | Exceptional 43.8% |
| Slovenes | 100.0 /100 | #15 | Exceptional 43.7% |
Demographics Similar to Latvians by In Labor Force | Age 16-19
In terms of in labor force | age 16-19, the demographic groups most similar to Latvians are Immigrants from North America (38.9%, a difference of 0.030%), Greek (38.9%, a difference of 0.040%), Ugandan (38.9%, a difference of 0.050%), Immigrants from North Macedonia (38.9%, a difference of 0.070%), and Immigrants from Canada (38.9%, a difference of 0.12%).
| Demographics | Rating | Rank | In Labor Force | Age 16-19 |
| Alaska Natives | 99.6 /100 | #89 | Exceptional 39.1% |
| Immigrants | Burma/Myanmar | 99.5 /100 | #90 | Exceptional 39.0% |
| Spanish Americans | 99.5 /100 | #91 | Exceptional 39.0% |
| Osage | 99.4 /100 | #92 | Exceptional 39.0% |
| Blackfeet | 99.4 /100 | #93 | Exceptional 38.9% |
| Immigrants | Canada | 99.4 /100 | #94 | Exceptional 38.9% |
| Immigrants | North America | 99.4 /100 | #95 | Exceptional 38.9% |
| Latvians | 99.4 /100 | #96 | Exceptional 38.9% |
| Greeks | 99.3 /100 | #97 | Exceptional 38.9% |
| Ugandans | 99.3 /100 | #98 | Exceptional 38.9% |
| Immigrants | North Macedonia | 99.3 /100 | #99 | Exceptional 38.9% |
| Immigrants | Thailand | 99.1 /100 | #100 | Exceptional 38.7% |
| Hmong | 99.1 /100 | #101 | Exceptional 38.7% |
| Zimbabweans | 99.1 /100 | #102 | Exceptional 38.7% |
| Immigrants | Cameroon | 99.0 /100 | #103 | Exceptional 38.7% |