Puerto Rican vs Latvian In Labor Force | Age 16-19
COMPARE
Puerto Rican
Latvian
In Labor Force | Age 16-19
In Labor Force | Age 16-19 Comparison
Puerto Ricans
Latvians
30.3%
IN LABOR FORCE | AGE 16-19
0.0/ 100
METRIC RATING
334th/ 347
METRIC RANK
38.9%
IN LABOR FORCE | AGE 16-19
99.4/ 100
METRIC RATING
96th/ 347
METRIC RANK
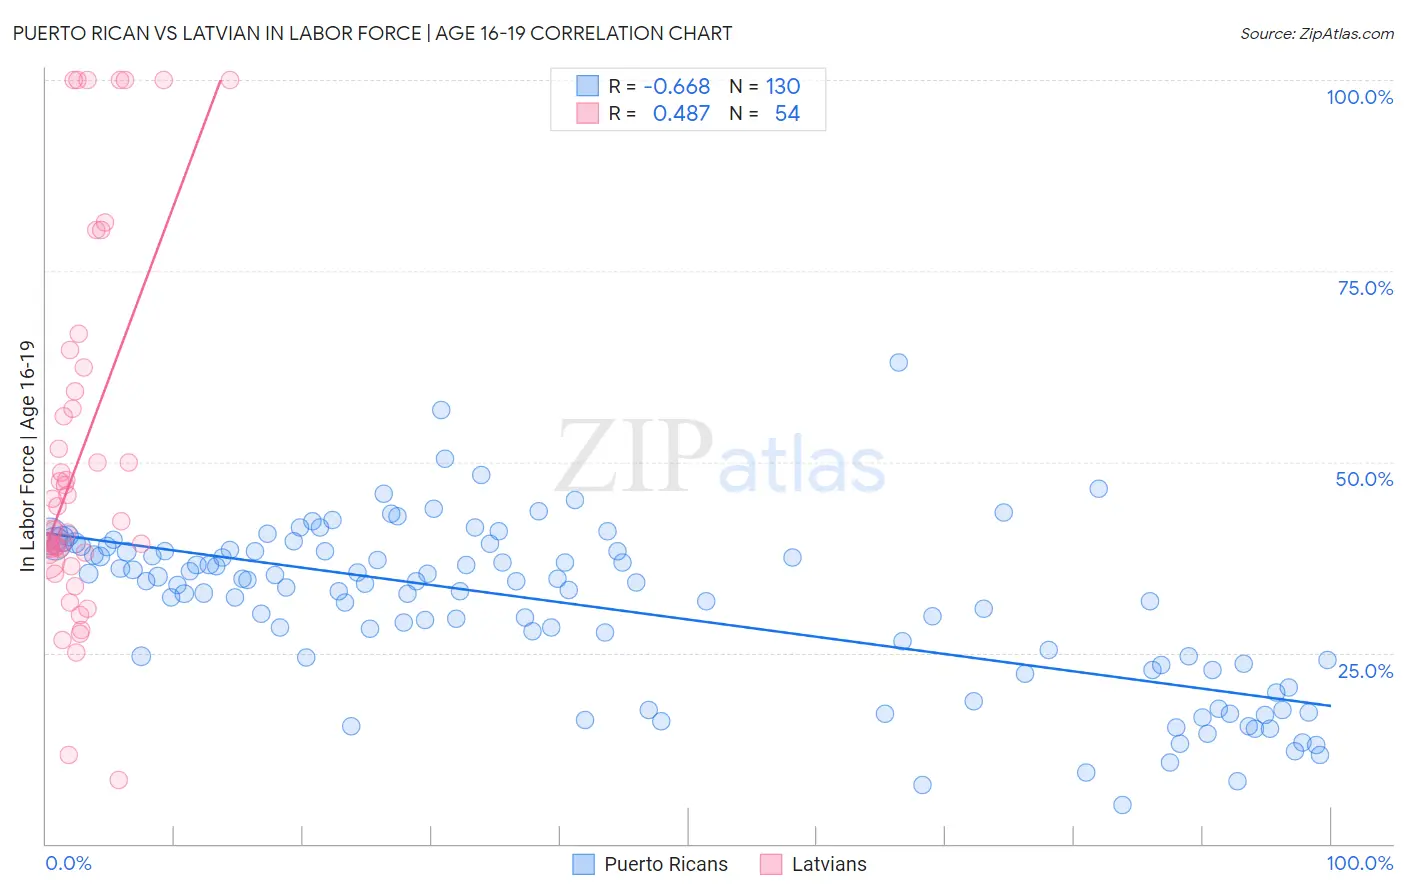
Puerto Rican vs Latvian In Labor Force | Age 16-19 Correlation Chart
The statistical analysis conducted on geographies consisting of 526,303,316 people shows a significant negative correlation between the proportion of Puerto Ricans and labor force participation rate among population between the ages 16 and 19 in the United States with a correlation coefficient (R) of -0.668 and weighted average of 30.3%. Similarly, the statistical analysis conducted on geographies consisting of 220,454,154 people shows a moderate positive correlation between the proportion of Latvians and labor force participation rate among population between the ages 16 and 19 in the United States with a correlation coefficient (R) of 0.487 and weighted average of 38.9%, a difference of 28.1%.
In Labor Force | Age 16-19 Correlation Summary
| Measurement | Puerto Rican | Latvian |
| Minimum | 5.1% | 8.4% |
| Maximum | 63.0% | 100.0% |
| Range | 57.9% | 91.6% |
| Mean | 31.0% | 50.8% |
| Median | 34.0% | 41.8% |
| Interquartile 25% (IQ1) | 23.4% | 37.8% |
| Interquartile 75% (IQ3) | 38.3% | 59.2% |
| Interquartile Range (IQR) | 14.9% | 21.4% |
| Standard Deviation (Sample) | 10.9% | 23.9% |
| Standard Deviation (Population) | 10.8% | 23.6% |
Similar Demographics by In Labor Force | Age 16-19
Demographics Similar to Puerto Ricans by In Labor Force | Age 16-19
In terms of in labor force | age 16-19, the demographic groups most similar to Puerto Ricans are Immigrants from Cuba (30.2%, a difference of 0.33%), Immigrants from Hong Kong (30.5%, a difference of 0.42%), Immigrants from Israel (30.5%, a difference of 0.44%), Immigrants from Trinidad and Tobago (30.2%, a difference of 0.62%), and Immigrants from Bangladesh (30.0%, a difference of 0.99%).
| Demographics | Rating | Rank | In Labor Force | Age 16-19 |
| Immigrants | Taiwan | 0.0 /100 | #327 | Tragic 31.0% |
| Immigrants | Ecuador | 0.0 /100 | #328 | Tragic 31.0% |
| Barbadians | 0.0 /100 | #329 | Tragic 31.0% |
| Lumbee | 0.0 /100 | #330 | Tragic 31.0% |
| Trinidadians and Tobagonians | 0.0 /100 | #331 | Tragic 30.9% |
| Immigrants | Israel | 0.0 /100 | #332 | Tragic 30.5% |
| Immigrants | Hong Kong | 0.0 /100 | #333 | Tragic 30.5% |
| Puerto Ricans | 0.0 /100 | #334 | Tragic 30.3% |
| Immigrants | Cuba | 0.0 /100 | #335 | Tragic 30.2% |
| Immigrants | Trinidad and Tobago | 0.0 /100 | #336 | Tragic 30.2% |
| Immigrants | Bangladesh | 0.0 /100 | #337 | Tragic 30.0% |
| Vietnamese | 0.0 /100 | #338 | Tragic 29.6% |
| Immigrants | Uzbekistan | 0.0 /100 | #339 | Tragic 29.2% |
| British West Indians | 0.0 /100 | #340 | Tragic 29.1% |
| Immigrants | Armenia | 0.0 /100 | #341 | Tragic 29.0% |
Demographics Similar to Latvians by In Labor Force | Age 16-19
In terms of in labor force | age 16-19, the demographic groups most similar to Latvians are Immigrants from North America (38.9%, a difference of 0.030%), Greek (38.9%, a difference of 0.040%), Ugandan (38.9%, a difference of 0.050%), Immigrants from North Macedonia (38.9%, a difference of 0.070%), and Immigrants from Canada (38.9%, a difference of 0.12%).
| Demographics | Rating | Rank | In Labor Force | Age 16-19 |
| Alaska Natives | 99.6 /100 | #89 | Exceptional 39.1% |
| Immigrants | Burma/Myanmar | 99.5 /100 | #90 | Exceptional 39.0% |
| Spanish Americans | 99.5 /100 | #91 | Exceptional 39.0% |
| Osage | 99.4 /100 | #92 | Exceptional 39.0% |
| Blackfeet | 99.4 /100 | #93 | Exceptional 38.9% |
| Immigrants | Canada | 99.4 /100 | #94 | Exceptional 38.9% |
| Immigrants | North America | 99.4 /100 | #95 | Exceptional 38.9% |
| Latvians | 99.4 /100 | #96 | Exceptional 38.9% |
| Greeks | 99.3 /100 | #97 | Exceptional 38.9% |
| Ugandans | 99.3 /100 | #98 | Exceptional 38.9% |
| Immigrants | North Macedonia | 99.3 /100 | #99 | Exceptional 38.9% |
| Immigrants | Thailand | 99.1 /100 | #100 | Exceptional 38.7% |
| Hmong | 99.1 /100 | #101 | Exceptional 38.7% |
| Zimbabweans | 99.1 /100 | #102 | Exceptional 38.7% |
| Immigrants | Cameroon | 99.0 /100 | #103 | Exceptional 38.7% |