Turkish vs Latvian In Labor Force | Age 16-19
COMPARE
Turkish
Latvian
In Labor Force | Age 16-19
In Labor Force | Age 16-19 Comparison
Turks
Latvians
35.4%
IN LABOR FORCE | AGE 16-19
7.3/ 100
METRIC RATING
221st/ 347
METRIC RANK
38.9%
IN LABOR FORCE | AGE 16-19
99.4/ 100
METRIC RATING
96th/ 347
METRIC RANK
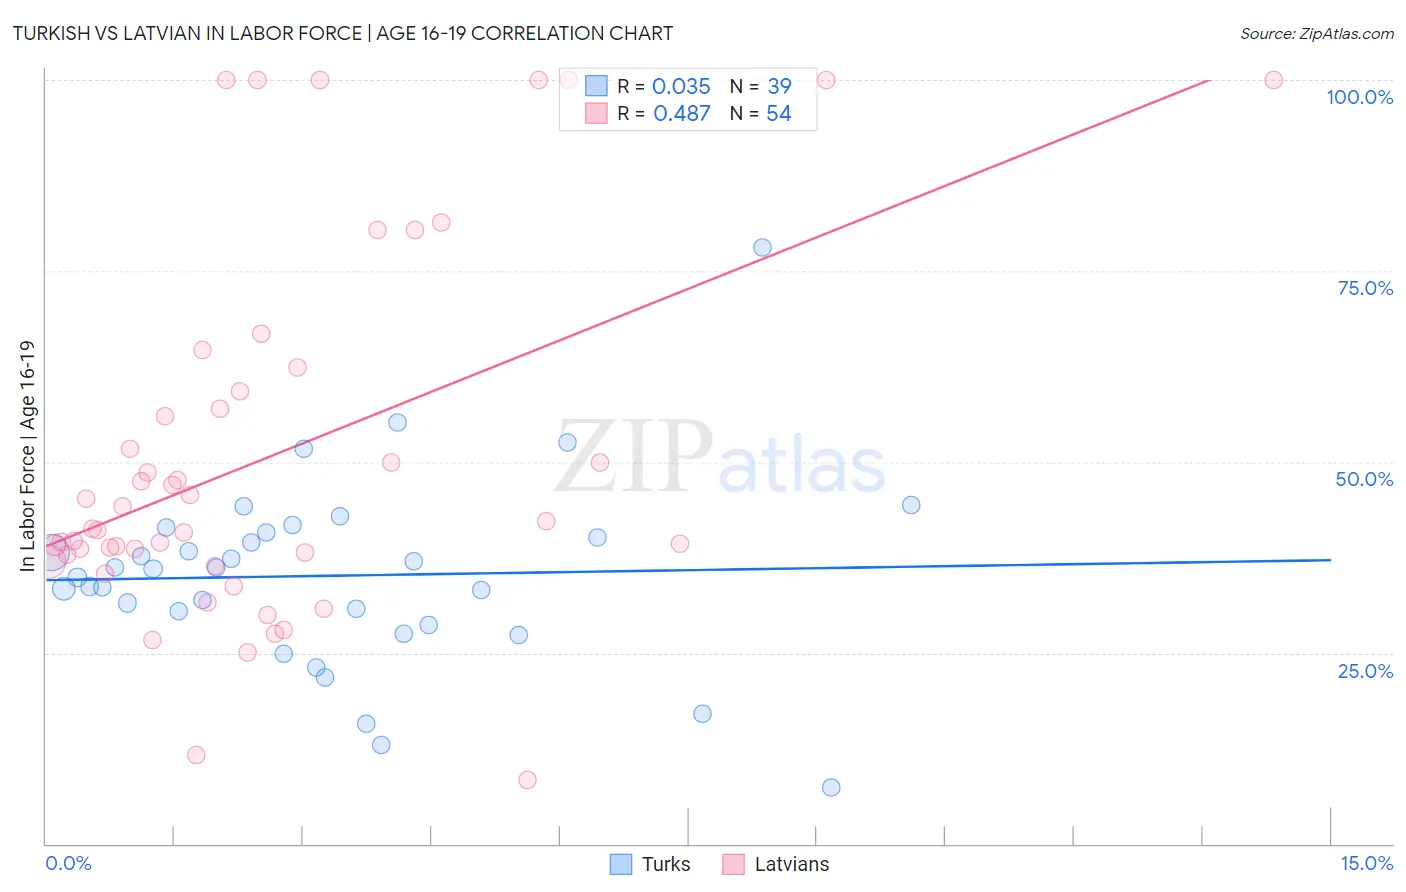
Turkish vs Latvian In Labor Force | Age 16-19 Correlation Chart
The statistical analysis conducted on geographies consisting of 271,508,687 people shows no correlation between the proportion of Turks and labor force participation rate among population between the ages 16 and 19 in the United States with a correlation coefficient (R) of 0.035 and weighted average of 35.4%. Similarly, the statistical analysis conducted on geographies consisting of 220,454,154 people shows a moderate positive correlation between the proportion of Latvians and labor force participation rate among population between the ages 16 and 19 in the United States with a correlation coefficient (R) of 0.487 and weighted average of 38.9%, a difference of 9.8%.
In Labor Force | Age 16-19 Correlation Summary
| Measurement | Turkish | Latvian |
| Minimum | 7.4% | 8.4% |
| Maximum | 78.1% | 100.0% |
| Range | 70.7% | 91.6% |
| Mean | 35.1% | 50.8% |
| Median | 36.0% | 41.8% |
| Interquartile 25% (IQ1) | 28.6% | 37.8% |
| Interquartile 75% (IQ3) | 40.8% | 59.2% |
| Interquartile Range (IQR) | 12.2% | 21.4% |
| Standard Deviation (Sample) | 12.4% | 23.9% |
| Standard Deviation (Population) | 12.3% | 23.6% |
Similar Demographics by In Labor Force | Age 16-19
Demographics Similar to Turks by In Labor Force | Age 16-19
In terms of in labor force | age 16-19, the demographic groups most similar to Turks are Immigrants from Ghana (35.4%, a difference of 0.010%), Ghanaian (35.3%, a difference of 0.16%), Honduran (35.3%, a difference of 0.17%), Immigrants from Bahamas (35.5%, a difference of 0.18%), and Guatemalan (35.5%, a difference of 0.23%).
| Demographics | Rating | Rank | In Labor Force | Age 16-19 |
| Apache | 11.0 /100 | #214 | Poor 35.6% |
| Immigrants | South Eastern Asia | 10.8 /100 | #215 | Poor 35.6% |
| Dutch West Indians | 10.7 /100 | #216 | Poor 35.6% |
| Immigrants | Costa Rica | 10.7 /100 | #217 | Poor 35.6% |
| Sri Lankans | 9.8 /100 | #218 | Tragic 35.5% |
| Guatemalans | 8.6 /100 | #219 | Tragic 35.5% |
| Immigrants | Bahamas | 8.3 /100 | #220 | Tragic 35.5% |
| Turks | 7.3 /100 | #221 | Tragic 35.4% |
| Immigrants | Ghana | 7.3 /100 | #222 | Tragic 35.4% |
| Ghanaians | 6.5 /100 | #223 | Tragic 35.3% |
| Hondurans | 6.5 /100 | #224 | Tragic 35.3% |
| Immigrants | Belgium | 6.1 /100 | #225 | Tragic 35.3% |
| Immigrants | Guatemala | 5.7 /100 | #226 | Tragic 35.3% |
| Mongolians | 5.7 /100 | #227 | Tragic 35.3% |
| Immigrants | Senegal | 5.5 /100 | #228 | Tragic 35.3% |
Demographics Similar to Latvians by In Labor Force | Age 16-19
In terms of in labor force | age 16-19, the demographic groups most similar to Latvians are Immigrants from North America (38.9%, a difference of 0.030%), Greek (38.9%, a difference of 0.040%), Ugandan (38.9%, a difference of 0.050%), Immigrants from North Macedonia (38.9%, a difference of 0.070%), and Immigrants from Canada (38.9%, a difference of 0.12%).
| Demographics | Rating | Rank | In Labor Force | Age 16-19 |
| Alaska Natives | 99.6 /100 | #89 | Exceptional 39.1% |
| Immigrants | Burma/Myanmar | 99.5 /100 | #90 | Exceptional 39.0% |
| Spanish Americans | 99.5 /100 | #91 | Exceptional 39.0% |
| Osage | 99.4 /100 | #92 | Exceptional 39.0% |
| Blackfeet | 99.4 /100 | #93 | Exceptional 38.9% |
| Immigrants | Canada | 99.4 /100 | #94 | Exceptional 38.9% |
| Immigrants | North America | 99.4 /100 | #95 | Exceptional 38.9% |
| Latvians | 99.4 /100 | #96 | Exceptional 38.9% |
| Greeks | 99.3 /100 | #97 | Exceptional 38.9% |
| Ugandans | 99.3 /100 | #98 | Exceptional 38.9% |
| Immigrants | North Macedonia | 99.3 /100 | #99 | Exceptional 38.9% |
| Immigrants | Thailand | 99.1 /100 | #100 | Exceptional 38.7% |
| Hmong | 99.1 /100 | #101 | Exceptional 38.7% |
| Zimbabweans | 99.1 /100 | #102 | Exceptional 38.7% |
| Immigrants | Cameroon | 99.0 /100 | #103 | Exceptional 38.7% |