Danish vs Dutch West Indian In Labor Force | Age 25-29
COMPARE
Danish
Dutch West Indian
In Labor Force | Age 25-29
In Labor Force | Age 25-29 Comparison
Danes
Dutch West Indians
84.8%
IN LABOR FORCE | AGE 25-29
71.9/ 100
METRIC RATING
141st/ 347
METRIC RANK
81.1%
IN LABOR FORCE | AGE 25-29
0.0/ 100
METRIC RATING
325th/ 347
METRIC RANK
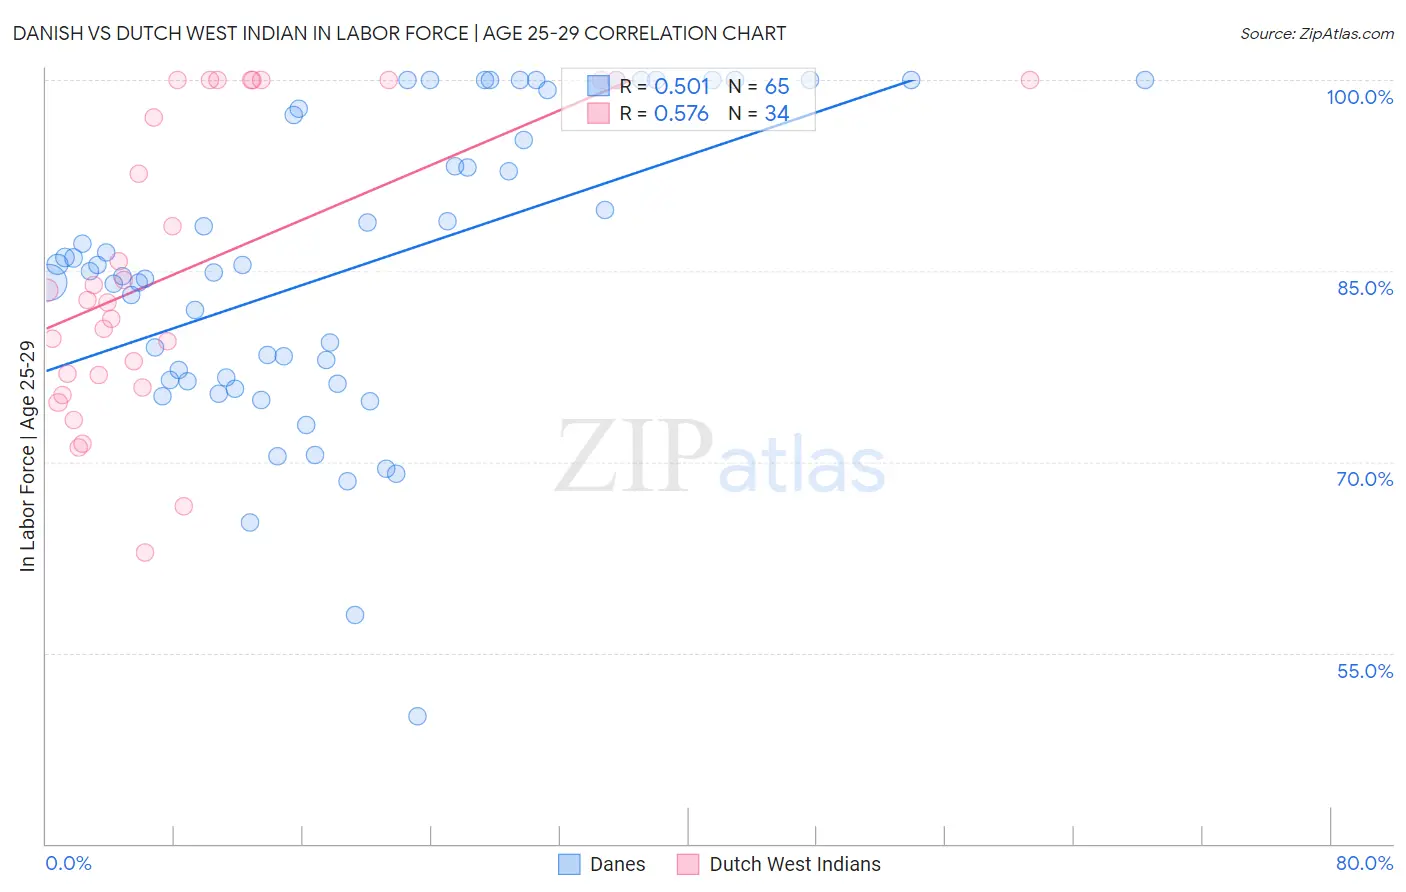
Danish vs Dutch West Indian In Labor Force | Age 25-29 Correlation Chart
The statistical analysis conducted on geographies consisting of 473,784,757 people shows a substantial positive correlation between the proportion of Danes and labor force participation rate among population between the ages 25 and 29 in the United States with a correlation coefficient (R) of 0.501 and weighted average of 84.8%. Similarly, the statistical analysis conducted on geographies consisting of 85,749,797 people shows a substantial positive correlation between the proportion of Dutch West Indians and labor force participation rate among population between the ages 25 and 29 in the United States with a correlation coefficient (R) of 0.576 and weighted average of 81.1%, a difference of 4.5%.
In Labor Force | Age 25-29 Correlation Summary
| Measurement | Danish | Dutch West Indian |
| Minimum | 50.0% | 62.9% |
| Maximum | 100.0% | 100.0% |
| Range | 50.0% | 37.1% |
| Mean | 85.1% | 85.4% |
| Median | 85.0% | 83.1% |
| Interquartile 25% (IQ1) | 76.4% | 76.8% |
| Interquartile 75% (IQ3) | 97.5% | 100.0% |
| Interquartile Range (IQR) | 21.1% | 23.2% |
| Standard Deviation (Sample) | 11.7% | 11.5% |
| Standard Deviation (Population) | 11.6% | 11.4% |
Similar Demographics by In Labor Force | Age 25-29
Demographics Similar to Danes by In Labor Force | Age 25-29
In terms of in labor force | age 25-29, the demographic groups most similar to Danes are Immigrants from North America (84.8%, a difference of 0.0%), Armenian (84.8%, a difference of 0.010%), Immigrants from Eastern Asia (84.8%, a difference of 0.010%), Immigrants from Canada (84.8%, a difference of 0.020%), and Pakistani (84.8%, a difference of 0.020%).
| Demographics | Rating | Rank | In Labor Force | Age 25-29 |
| Syrians | 76.5 /100 | #134 | Good 84.8% |
| Immigrants | Hungary | 76.4 /100 | #135 | Good 84.8% |
| Bhutanese | 76.0 /100 | #136 | Good 84.8% |
| Immigrants | Canada | 73.5 /100 | #137 | Good 84.8% |
| Armenians | 72.7 /100 | #138 | Good 84.8% |
| Immigrants | Eastern Asia | 72.6 /100 | #139 | Good 84.8% |
| Immigrants | North America | 72.1 /100 | #140 | Good 84.8% |
| Danes | 71.9 /100 | #141 | Good 84.8% |
| Pakistanis | 70.0 /100 | #142 | Good 84.8% |
| Sri Lankans | 69.2 /100 | #143 | Good 84.8% |
| Immigrants | Laos | 69.0 /100 | #144 | Good 84.8% |
| Immigrants | Senegal | 68.3 /100 | #145 | Good 84.8% |
| Icelanders | 68.2 /100 | #146 | Good 84.8% |
| Immigrants | Asia | 68.2 /100 | #147 | Good 84.8% |
| Immigrants | England | 65.2 /100 | #148 | Good 84.7% |
Demographics Similar to Dutch West Indians by In Labor Force | Age 25-29
In terms of in labor force | age 25-29, the demographic groups most similar to Dutch West Indians are Houma (81.2%, a difference of 0.11%), Choctaw (81.0%, a difference of 0.20%), Ute (80.8%, a difference of 0.41%), Alaska Native (81.6%, a difference of 0.52%), and Creek (80.7%, a difference of 0.55%).
| Demographics | Rating | Rank | In Labor Force | Age 25-29 |
| Comanche | 0.0 /100 | #318 | Tragic 81.9% |
| Seminole | 0.0 /100 | #319 | Tragic 81.7% |
| Colville | 0.0 /100 | #320 | Tragic 81.6% |
| Shoshone | 0.0 /100 | #321 | Tragic 81.6% |
| Kiowa | 0.0 /100 | #322 | Tragic 81.6% |
| Alaska Natives | 0.0 /100 | #323 | Tragic 81.6% |
| Houma | 0.0 /100 | #324 | Tragic 81.2% |
| Dutch West Indians | 0.0 /100 | #325 | Tragic 81.1% |
| Choctaw | 0.0 /100 | #326 | Tragic 81.0% |
| Ute | 0.0 /100 | #327 | Tragic 80.8% |
| Creek | 0.0 /100 | #328 | Tragic 80.7% |
| Yakama | 0.0 /100 | #329 | Tragic 80.6% |
| Puerto Ricans | 0.0 /100 | #330 | Tragic 80.4% |
| Cheyenne | 0.0 /100 | #331 | Tragic 80.3% |
| Inupiat | 0.0 /100 | #332 | Tragic 79.8% |