Danish vs Nonimmigrants In Labor Force | Age 25-29
COMPARE
Danish
Nonimmigrants
In Labor Force | Age 25-29
In Labor Force | Age 25-29 Comparison
Danes
Nonimmigrants
84.8%
IN LABOR FORCE | AGE 25-29
71.9/ 100
METRIC RATING
141st/ 347
METRIC RANK
83.7%
IN LABOR FORCE | AGE 25-29
0.3/ 100
METRIC RATING
248th/ 347
METRIC RANK
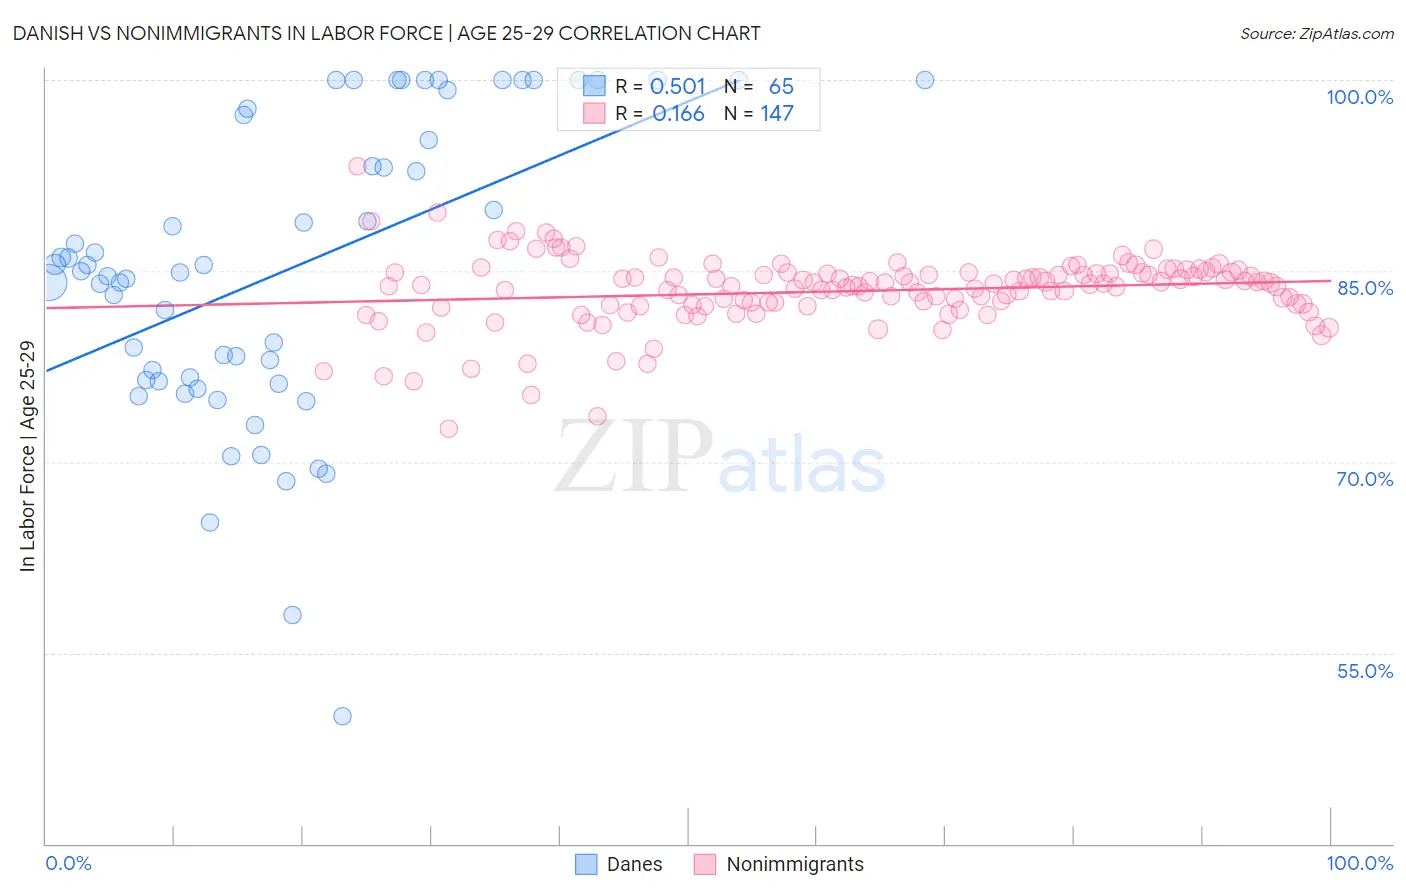
Danish vs Nonimmigrants In Labor Force | Age 25-29 Correlation Chart
The statistical analysis conducted on geographies consisting of 473,784,757 people shows a substantial positive correlation between the proportion of Danes and labor force participation rate among population between the ages 25 and 29 in the United States with a correlation coefficient (R) of 0.501 and weighted average of 84.8%. Similarly, the statistical analysis conducted on geographies consisting of 582,659,660 people shows a poor positive correlation between the proportion of Nonimmigrants and labor force participation rate among population between the ages 25 and 29 in the United States with a correlation coefficient (R) of 0.166 and weighted average of 83.7%, a difference of 1.3%.
In Labor Force | Age 25-29 Correlation Summary
| Measurement | Danish | Nonimmigrants |
| Minimum | 50.0% | 72.6% |
| Maximum | 100.0% | 93.2% |
| Range | 50.0% | 20.6% |
| Mean | 85.1% | 83.4% |
| Median | 85.0% | 83.9% |
| Interquartile 25% (IQ1) | 76.4% | 82.3% |
| Interquartile 75% (IQ3) | 97.5% | 84.8% |
| Interquartile Range (IQR) | 21.1% | 2.5% |
| Standard Deviation (Sample) | 11.7% | 2.8% |
| Standard Deviation (Population) | 11.6% | 2.8% |
Similar Demographics by In Labor Force | Age 25-29
Demographics Similar to Danes by In Labor Force | Age 25-29
In terms of in labor force | age 25-29, the demographic groups most similar to Danes are Immigrants from North America (84.8%, a difference of 0.0%), Armenian (84.8%, a difference of 0.010%), Immigrants from Eastern Asia (84.8%, a difference of 0.010%), Immigrants from Canada (84.8%, a difference of 0.020%), and Pakistani (84.8%, a difference of 0.020%).
| Demographics | Rating | Rank | In Labor Force | Age 25-29 |
| Syrians | 76.5 /100 | #134 | Good 84.8% |
| Immigrants | Hungary | 76.4 /100 | #135 | Good 84.8% |
| Bhutanese | 76.0 /100 | #136 | Good 84.8% |
| Immigrants | Canada | 73.5 /100 | #137 | Good 84.8% |
| Armenians | 72.7 /100 | #138 | Good 84.8% |
| Immigrants | Eastern Asia | 72.6 /100 | #139 | Good 84.8% |
| Immigrants | North America | 72.1 /100 | #140 | Good 84.8% |
| Danes | 71.9 /100 | #141 | Good 84.8% |
| Pakistanis | 70.0 /100 | #142 | Good 84.8% |
| Sri Lankans | 69.2 /100 | #143 | Good 84.8% |
| Immigrants | Laos | 69.0 /100 | #144 | Good 84.8% |
| Immigrants | Senegal | 68.3 /100 | #145 | Good 84.8% |
| Icelanders | 68.2 /100 | #146 | Good 84.8% |
| Immigrants | Asia | 68.2 /100 | #147 | Good 84.8% |
| Immigrants | England | 65.2 /100 | #148 | Good 84.7% |
Demographics Similar to Nonimmigrants by In Labor Force | Age 25-29
In terms of in labor force | age 25-29, the demographic groups most similar to Nonimmigrants are Hmong (83.7%, a difference of 0.010%), Immigrants from El Salvador (83.7%, a difference of 0.020%), Cree (83.8%, a difference of 0.030%), Central American (83.7%, a difference of 0.030%), and Bahamian (83.7%, a difference of 0.040%).
| Demographics | Rating | Rank | In Labor Force | Age 25-29 |
| Alsatians | 0.7 /100 | #241 | Tragic 83.9% |
| U.S. Virgin Islanders | 0.6 /100 | #242 | Tragic 83.8% |
| Salvadorans | 0.5 /100 | #243 | Tragic 83.8% |
| Immigrants | Jamaica | 0.4 /100 | #244 | Tragic 83.8% |
| Iroquois | 0.4 /100 | #245 | Tragic 83.8% |
| Cree | 0.3 /100 | #246 | Tragic 83.8% |
| Immigrants | El Salvador | 0.3 /100 | #247 | Tragic 83.7% |
| Immigrants | Nonimmigrants | 0.3 /100 | #248 | Tragic 83.7% |
| Hmong | 0.3 /100 | #249 | Tragic 83.7% |
| Central Americans | 0.2 /100 | #250 | Tragic 83.7% |
| Bahamians | 0.2 /100 | #251 | Tragic 83.7% |
| Guatemalans | 0.2 /100 | #252 | Tragic 83.7% |
| Immigrants | Trinidad and Tobago | 0.2 /100 | #253 | Tragic 83.7% |
| Spaniards | 0.2 /100 | #254 | Tragic 83.7% |
| Haitians | 0.2 /100 | #255 | Tragic 83.7% |