Danish vs Mongolian In Labor Force | Age 25-29
COMPARE
Danish
Mongolian
In Labor Force | Age 25-29
In Labor Force | Age 25-29 Comparison
Danes
Mongolians
84.8%
IN LABOR FORCE | AGE 25-29
71.9/ 100
METRIC RATING
141st/ 347
METRIC RANK
85.1%
IN LABOR FORCE | AGE 25-29
94.1/ 100
METRIC RATING
98th/ 347
METRIC RANK
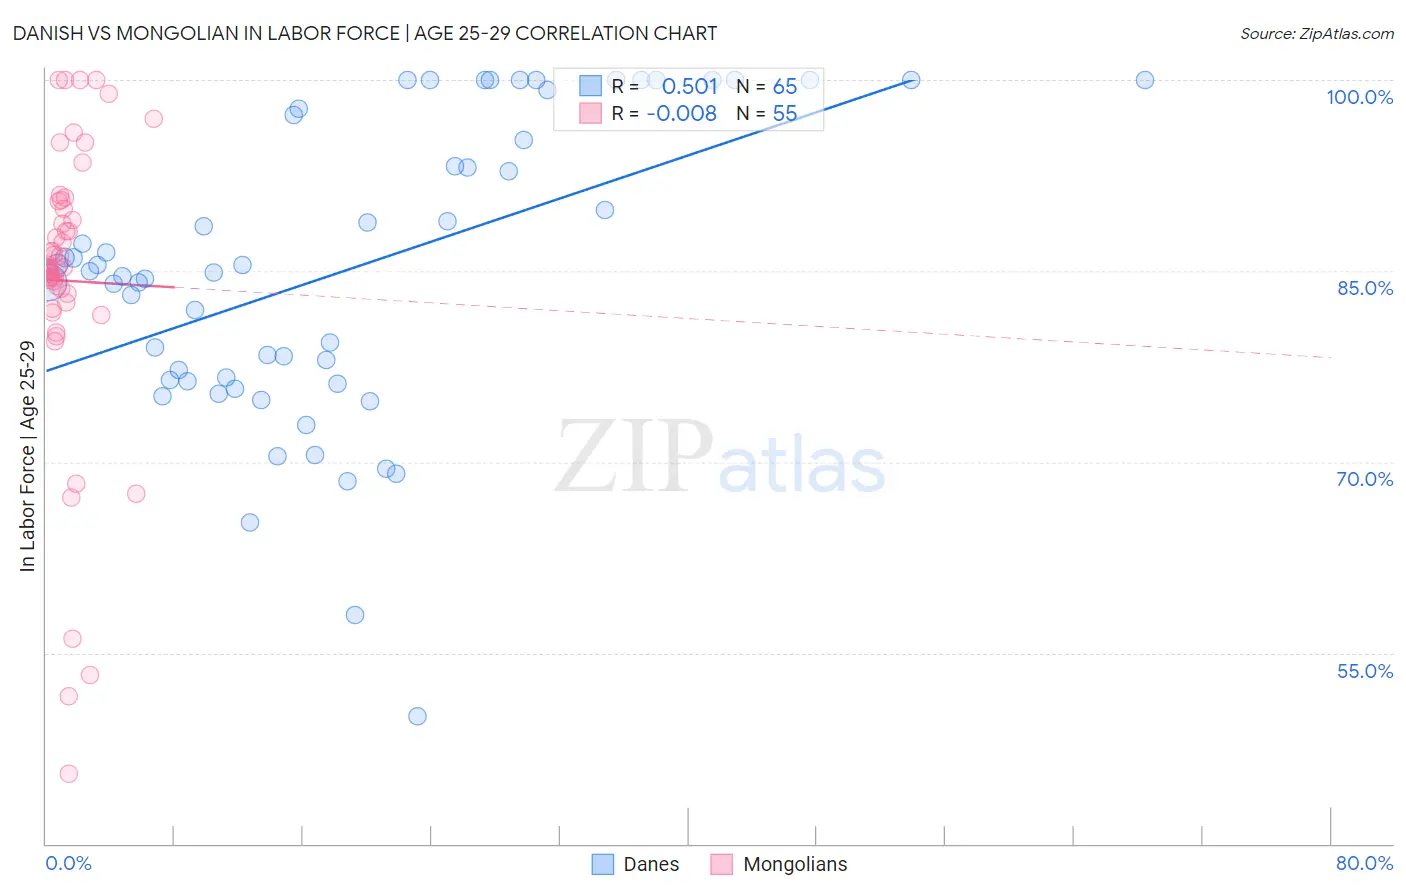
Danish vs Mongolian In Labor Force | Age 25-29 Correlation Chart
The statistical analysis conducted on geographies consisting of 473,784,757 people shows a substantial positive correlation between the proportion of Danes and labor force participation rate among population between the ages 25 and 29 in the United States with a correlation coefficient (R) of 0.501 and weighted average of 84.8%. Similarly, the statistical analysis conducted on geographies consisting of 140,349,475 people shows no correlation between the proportion of Mongolians and labor force participation rate among population between the ages 25 and 29 in the United States with a correlation coefficient (R) of -0.008 and weighted average of 85.1%, a difference of 0.34%.
In Labor Force | Age 25-29 Correlation Summary
| Measurement | Danish | Mongolian |
| Minimum | 50.0% | 45.5% |
| Maximum | 100.0% | 100.0% |
| Range | 50.0% | 54.5% |
| Mean | 85.1% | 84.2% |
| Median | 85.0% | 85.2% |
| Interquartile 25% (IQ1) | 76.4% | 82.5% |
| Interquartile 75% (IQ3) | 97.5% | 90.5% |
| Interquartile Range (IQR) | 21.1% | 8.0% |
| Standard Deviation (Sample) | 11.7% | 11.7% |
| Standard Deviation (Population) | 11.6% | 11.6% |
Similar Demographics by In Labor Force | Age 25-29
Demographics Similar to Danes by In Labor Force | Age 25-29
In terms of in labor force | age 25-29, the demographic groups most similar to Danes are Immigrants from North America (84.8%, a difference of 0.0%), Armenian (84.8%, a difference of 0.010%), Immigrants from Eastern Asia (84.8%, a difference of 0.010%), Immigrants from Canada (84.8%, a difference of 0.020%), and Pakistani (84.8%, a difference of 0.020%).
| Demographics | Rating | Rank | In Labor Force | Age 25-29 |
| Syrians | 76.5 /100 | #134 | Good 84.8% |
| Immigrants | Hungary | 76.4 /100 | #135 | Good 84.8% |
| Bhutanese | 76.0 /100 | #136 | Good 84.8% |
| Immigrants | Canada | 73.5 /100 | #137 | Good 84.8% |
| Armenians | 72.7 /100 | #138 | Good 84.8% |
| Immigrants | Eastern Asia | 72.6 /100 | #139 | Good 84.8% |
| Immigrants | North America | 72.1 /100 | #140 | Good 84.8% |
| Danes | 71.9 /100 | #141 | Good 84.8% |
| Pakistanis | 70.0 /100 | #142 | Good 84.8% |
| Sri Lankans | 69.2 /100 | #143 | Good 84.8% |
| Immigrants | Laos | 69.0 /100 | #144 | Good 84.8% |
| Immigrants | Senegal | 68.3 /100 | #145 | Good 84.8% |
| Icelanders | 68.2 /100 | #146 | Good 84.8% |
| Immigrants | Asia | 68.2 /100 | #147 | Good 84.8% |
| Immigrants | England | 65.2 /100 | #148 | Good 84.7% |
Demographics Similar to Mongolians by In Labor Force | Age 25-29
In terms of in labor force | age 25-29, the demographic groups most similar to Mongolians are Bangladeshi (85.1%, a difference of 0.0%), Immigrants from Sudan (85.1%, a difference of 0.010%), Immigrants from Switzerland (85.1%, a difference of 0.010%), Egyptian (85.1%, a difference of 0.010%), and Slavic (85.1%, a difference of 0.010%).
| Demographics | Rating | Rank | In Labor Force | Age 25-29 |
| Immigrants | Moldova | 95.8 /100 | #91 | Exceptional 85.1% |
| Immigrants | Costa Rica | 95.5 /100 | #92 | Exceptional 85.1% |
| Austrians | 95.3 /100 | #93 | Exceptional 85.1% |
| Immigrants | Korea | 94.8 /100 | #94 | Exceptional 85.1% |
| Immigrants | Netherlands | 94.6 /100 | #95 | Exceptional 85.1% |
| Immigrants | Romania | 94.6 /100 | #96 | Exceptional 85.1% |
| Immigrants | Sudan | 94.3 /100 | #97 | Exceptional 85.1% |
| Mongolians | 94.1 /100 | #98 | Exceptional 85.1% |
| Bangladeshis | 94.0 /100 | #99 | Exceptional 85.1% |
| Immigrants | Switzerland | 93.9 /100 | #100 | Exceptional 85.1% |
| Egyptians | 93.8 /100 | #101 | Exceptional 85.1% |
| Slavs | 93.7 /100 | #102 | Exceptional 85.1% |
| Immigrants | Japan | 93.5 /100 | #103 | Exceptional 85.1% |
| Immigrants | Zaire | 93.3 /100 | #104 | Exceptional 85.1% |
| Immigrants | Hong Kong | 92.8 /100 | #105 | Exceptional 85.0% |