Immigrants from Ethiopia vs Dutch West Indian In Labor Force | Age 25-29
COMPARE
Immigrants from Ethiopia
Dutch West Indian
In Labor Force | Age 25-29
In Labor Force | Age 25-29 Comparison
Immigrants from Ethiopia
Dutch West Indians
86.1%
IN LABOR FORCE | AGE 25-29
100.0/ 100
METRIC RATING
11th/ 347
METRIC RANK
81.1%
IN LABOR FORCE | AGE 25-29
0.0/ 100
METRIC RATING
325th/ 347
METRIC RANK
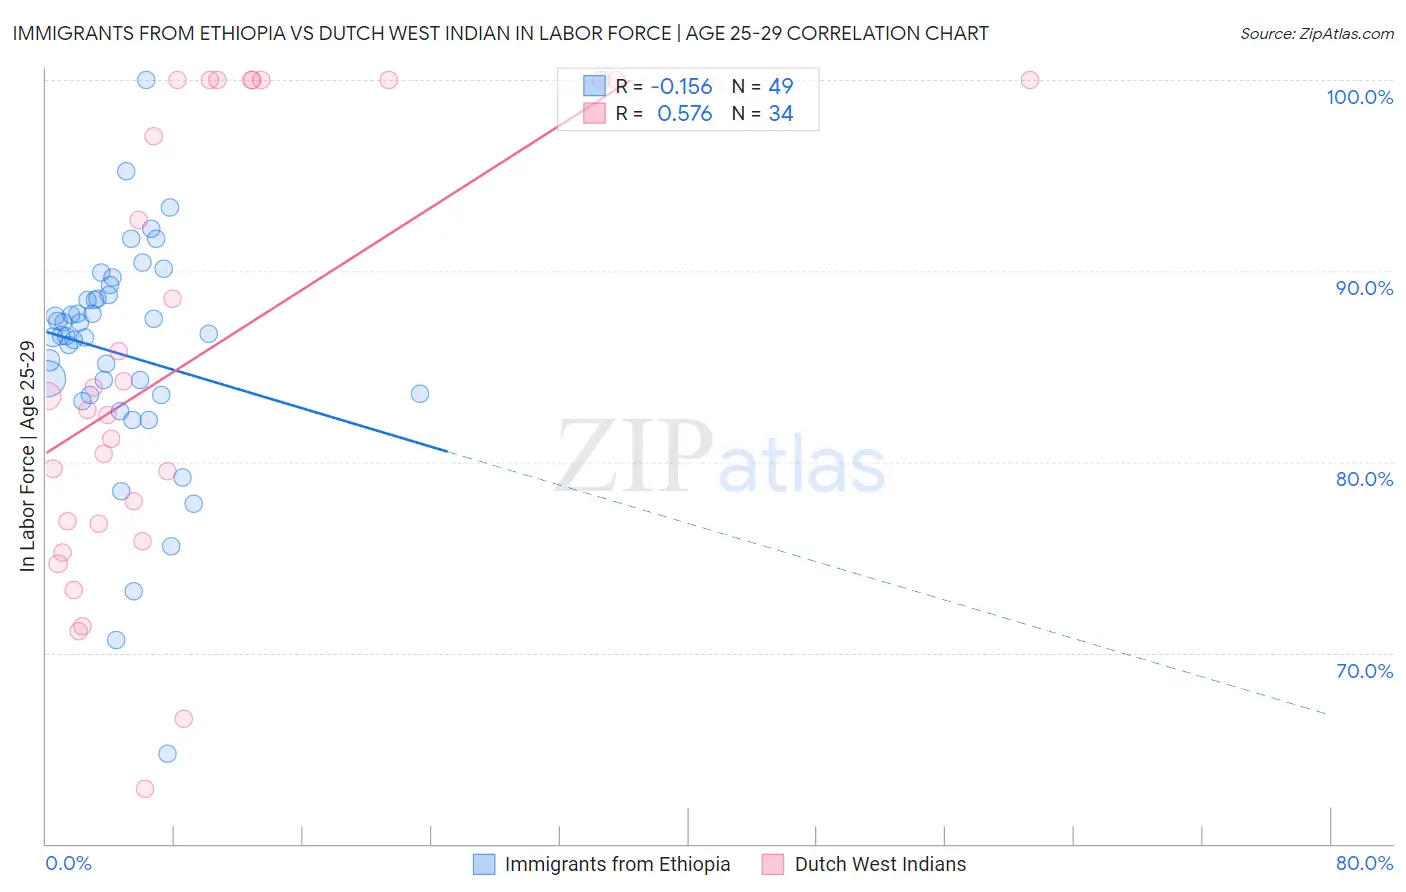
Immigrants from Ethiopia vs Dutch West Indian In Labor Force | Age 25-29 Correlation Chart
The statistical analysis conducted on geographies consisting of 211,531,524 people shows a poor negative correlation between the proportion of Immigrants from Ethiopia and labor force participation rate among population between the ages 25 and 29 in the United States with a correlation coefficient (R) of -0.156 and weighted average of 86.1%. Similarly, the statistical analysis conducted on geographies consisting of 85,749,797 people shows a substantial positive correlation between the proportion of Dutch West Indians and labor force participation rate among population between the ages 25 and 29 in the United States with a correlation coefficient (R) of 0.576 and weighted average of 81.1%, a difference of 6.2%.
In Labor Force | Age 25-29 Correlation Summary
| Measurement | Immigrants from Ethiopia | Dutch West Indian |
| Minimum | 64.7% | 62.9% |
| Maximum | 100.0% | 100.0% |
| Range | 35.3% | 37.1% |
| Mean | 85.7% | 85.4% |
| Median | 86.6% | 83.1% |
| Interquartile 25% (IQ1) | 83.5% | 76.8% |
| Interquartile 75% (IQ3) | 88.6% | 100.0% |
| Interquartile Range (IQR) | 5.2% | 23.2% |
| Standard Deviation (Sample) | 6.1% | 11.5% |
| Standard Deviation (Population) | 6.0% | 11.4% |
Similar Demographics by In Labor Force | Age 25-29
Demographics Similar to Immigrants from Ethiopia by In Labor Force | Age 25-29
In terms of in labor force | age 25-29, the demographic groups most similar to Immigrants from Ethiopia are Liberian (86.1%, a difference of 0.0%), Immigrants from Lithuania (86.1%, a difference of 0.010%), Norwegian (86.1%, a difference of 0.020%), Ethiopian (86.2%, a difference of 0.050%), and Latvian (86.1%, a difference of 0.050%).
| Demographics | Rating | Rank | In Labor Force | Age 25-29 |
| Carpatho Rusyns | 100.0 /100 | #4 | Exceptional 87.0% |
| Luxembourgers | 100.0 /100 | #5 | Exceptional 86.9% |
| Slovenes | 100.0 /100 | #6 | Exceptional 86.4% |
| Immigrants | Bosnia and Herzegovina | 100.0 /100 | #7 | Exceptional 86.3% |
| Immigrants | Cabo Verde | 100.0 /100 | #8 | Exceptional 86.2% |
| Ethiopians | 100.0 /100 | #9 | Exceptional 86.2% |
| Liberians | 100.0 /100 | #10 | Exceptional 86.1% |
| Immigrants | Ethiopia | 100.0 /100 | #11 | Exceptional 86.1% |
| Immigrants | Lithuania | 100.0 /100 | #12 | Exceptional 86.1% |
| Norwegians | 100.0 /100 | #13 | Exceptional 86.1% |
| Latvians | 100.0 /100 | #14 | Exceptional 86.1% |
| Bolivians | 100.0 /100 | #15 | Exceptional 86.1% |
| Immigrants | Bolivia | 100.0 /100 | #16 | Exceptional 86.1% |
| Bermudans | 100.0 /100 | #17 | Exceptional 86.0% |
| Bulgarians | 100.0 /100 | #18 | Exceptional 86.0% |
Demographics Similar to Dutch West Indians by In Labor Force | Age 25-29
In terms of in labor force | age 25-29, the demographic groups most similar to Dutch West Indians are Houma (81.2%, a difference of 0.11%), Choctaw (81.0%, a difference of 0.20%), Ute (80.8%, a difference of 0.41%), Alaska Native (81.6%, a difference of 0.52%), and Creek (80.7%, a difference of 0.55%).
| Demographics | Rating | Rank | In Labor Force | Age 25-29 |
| Comanche | 0.0 /100 | #318 | Tragic 81.9% |
| Seminole | 0.0 /100 | #319 | Tragic 81.7% |
| Colville | 0.0 /100 | #320 | Tragic 81.6% |
| Shoshone | 0.0 /100 | #321 | Tragic 81.6% |
| Kiowa | 0.0 /100 | #322 | Tragic 81.6% |
| Alaska Natives | 0.0 /100 | #323 | Tragic 81.6% |
| Houma | 0.0 /100 | #324 | Tragic 81.2% |
| Dutch West Indians | 0.0 /100 | #325 | Tragic 81.1% |
| Choctaw | 0.0 /100 | #326 | Tragic 81.0% |
| Ute | 0.0 /100 | #327 | Tragic 80.8% |
| Creek | 0.0 /100 | #328 | Tragic 80.7% |
| Yakama | 0.0 /100 | #329 | Tragic 80.6% |
| Puerto Ricans | 0.0 /100 | #330 | Tragic 80.4% |
| Cheyenne | 0.0 /100 | #331 | Tragic 80.3% |
| Inupiat | 0.0 /100 | #332 | Tragic 79.8% |