Danish vs Dutch West Indian Master's Degree
COMPARE
Danish
Dutch West Indian
Master's Degree
Master's Degree Comparison
Danes
Dutch West Indians
14.5%
MASTER'S DEGREE
31.3/ 100
METRIC RATING
195th/ 347
METRIC RANK
10.6%
MASTER'S DEGREE
0.0/ 100
METRIC RATING
324th/ 347
METRIC RANK
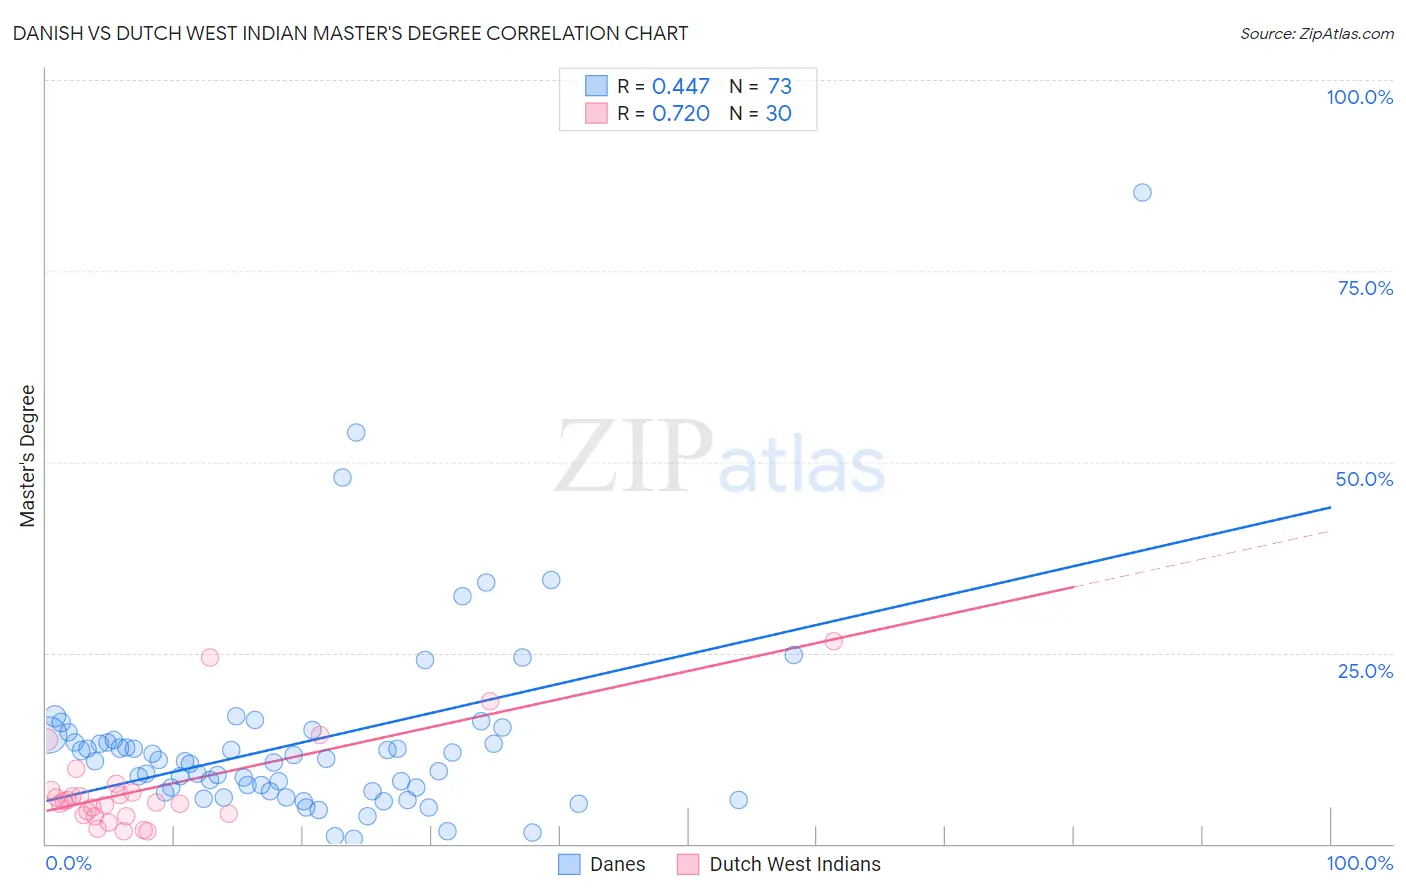
Danish vs Dutch West Indian Master's Degree Correlation Chart
The statistical analysis conducted on geographies consisting of 473,923,988 people shows a moderate positive correlation between the proportion of Danes and percentage of population with at least master's degree education in the United States with a correlation coefficient (R) of 0.447 and weighted average of 14.5%. Similarly, the statistical analysis conducted on geographies consisting of 85,760,776 people shows a strong positive correlation between the proportion of Dutch West Indians and percentage of population with at least master's degree education in the United States with a correlation coefficient (R) of 0.720 and weighted average of 10.6%, a difference of 36.9%.
Master's Degree Correlation Summary
| Measurement | Danish | Dutch West Indian |
| Minimum | 0.60% | 1.6% |
| Maximum | 85.3% | 26.5% |
| Range | 84.7% | 24.9% |
| Mean | 13.3% | 7.3% |
| Median | 10.8% | 5.5% |
| Interquartile 25% (IQ1) | 6.8% | 3.8% |
| Interquartile 75% (IQ3) | 13.9% | 7.1% |
| Interquartile Range (IQR) | 7.0% | 3.3% |
| Standard Deviation (Sample) | 12.7% | 6.2% |
| Standard Deviation (Population) | 12.6% | 6.1% |
Similar Demographics by Master's Degree
Demographics Similar to Danes by Master's Degree
In terms of master's degree, the demographic groups most similar to Danes are Chinese (14.6%, a difference of 0.18%), Immigrants from Nigeria (14.6%, a difference of 0.22%), Czechoslovakian (14.5%, a difference of 0.22%), Immigrants from Middle Africa (14.6%, a difference of 0.35%), and Welsh (14.6%, a difference of 0.44%).
| Demographics | Rating | Rank | Master's Degree |
| Immigrants | Costa Rica | 36.2 /100 | #188 | Fair 14.7% |
| Immigrants | Immigrants | 36.0 /100 | #189 | Fair 14.6% |
| Spaniards | 35.8 /100 | #190 | Fair 14.6% |
| Welsh | 34.2 /100 | #191 | Fair 14.6% |
| Immigrants | Middle Africa | 33.6 /100 | #192 | Fair 14.6% |
| Immigrants | Nigeria | 32.7 /100 | #193 | Fair 14.6% |
| Chinese | 32.5 /100 | #194 | Fair 14.6% |
| Danes | 31.3 /100 | #195 | Fair 14.5% |
| Czechoslovakians | 29.9 /100 | #196 | Fair 14.5% |
| Belgians | 28.0 /100 | #197 | Fair 14.5% |
| West Indians | 27.4 /100 | #198 | Fair 14.5% |
| Immigrants | Armenia | 27.2 /100 | #199 | Fair 14.5% |
| Panamanians | 25.1 /100 | #200 | Fair 14.4% |
| Scotch-Irish | 25.0 /100 | #201 | Fair 14.4% |
| Immigrants | Western Africa | 24.9 /100 | #202 | Fair 14.4% |
Demographics Similar to Dutch West Indians by Master's Degree
In terms of master's degree, the demographic groups most similar to Dutch West Indians are Crow (10.6%, a difference of 0.040%), Sioux (10.7%, a difference of 0.44%), Pennsylvania German (10.7%, a difference of 1.1%), Inupiat (10.5%, a difference of 1.1%), and Creek (10.5%, a difference of 1.1%).
| Demographics | Rating | Rank | Master's Degree |
| Hopi | 0.0 /100 | #317 | Tragic 10.9% |
| Immigrants | Cuba | 0.0 /100 | #318 | Tragic 10.9% |
| Kiowa | 0.0 /100 | #319 | Tragic 10.8% |
| Immigrants | Micronesia | 0.0 /100 | #320 | Tragic 10.8% |
| Pennsylvania Germans | 0.0 /100 | #321 | Tragic 10.7% |
| Sioux | 0.0 /100 | #322 | Tragic 10.7% |
| Crow | 0.0 /100 | #323 | Tragic 10.6% |
| Dutch West Indians | 0.0 /100 | #324 | Tragic 10.6% |
| Inupiat | 0.0 /100 | #325 | Tragic 10.5% |
| Creek | 0.0 /100 | #326 | Tragic 10.5% |
| Paiute | 0.0 /100 | #327 | Tragic 10.5% |
| Bangladeshis | 0.0 /100 | #328 | Tragic 10.5% |
| Nepalese | 0.0 /100 | #329 | Tragic 10.5% |
| Fijians | 0.0 /100 | #330 | Tragic 10.3% |
| Pueblo | 0.0 /100 | #331 | Tragic 10.3% |