Czech vs Indian (Asian) In Labor Force | Age 25-29
COMPARE
Czech
Indian (Asian)
In Labor Force | Age 25-29
In Labor Force | Age 25-29 Comparison
Czechs
Indians (Asian)
85.6%
IN LABOR FORCE | AGE 25-29
99.8/ 100
METRIC RATING
46th/ 347
METRIC RANK
84.7%
IN LABOR FORCE | AGE 25-29
61.6/ 100
METRIC RATING
155th/ 347
METRIC RANK
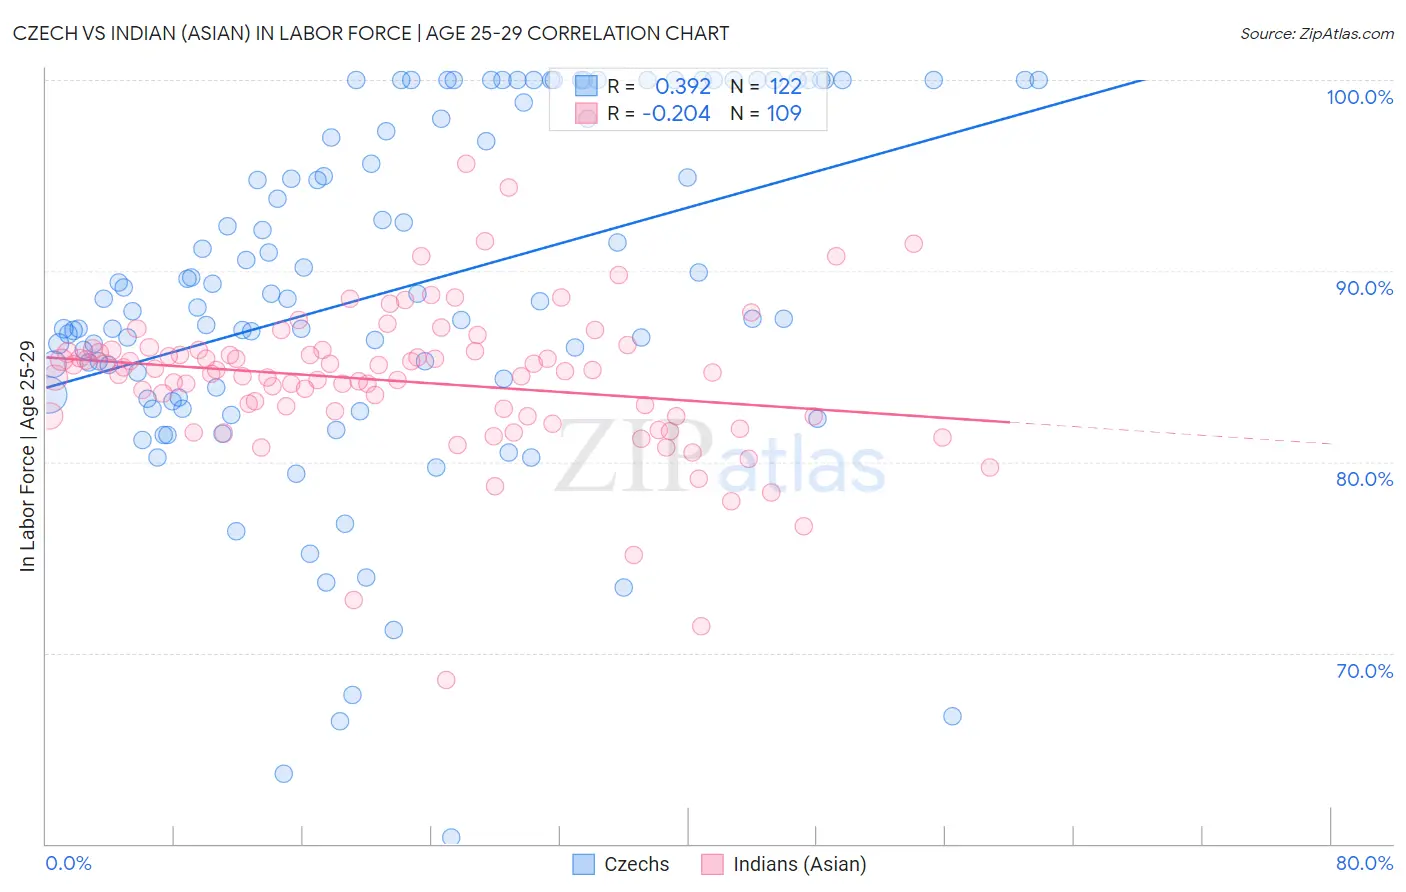
Czech vs Indian (Asian) In Labor Force | Age 25-29 Correlation Chart
The statistical analysis conducted on geographies consisting of 484,343,470 people shows a mild positive correlation between the proportion of Czechs and labor force participation rate among population between the ages 25 and 29 in the United States with a correlation coefficient (R) of 0.392 and weighted average of 85.6%. Similarly, the statistical analysis conducted on geographies consisting of 494,999,780 people shows a weak negative correlation between the proportion of Indians (Asian) and labor force participation rate among population between the ages 25 and 29 in the United States with a correlation coefficient (R) of -0.204 and weighted average of 84.7%, a difference of 1.1%.
In Labor Force | Age 25-29 Correlation Summary
| Measurement | Czech | Indian (Asian) |
| Minimum | 60.3% | 68.6% |
| Maximum | 100.0% | 95.6% |
| Range | 39.7% | 27.0% |
| Mean | 89.0% | 84.2% |
| Median | 88.5% | 84.7% |
| Interquartile 25% (IQ1) | 83.5% | 82.4% |
| Interquartile 75% (IQ3) | 98.0% | 85.8% |
| Interquartile Range (IQR) | 14.5% | 3.4% |
| Standard Deviation (Sample) | 9.1% | 3.9% |
| Standard Deviation (Population) | 9.0% | 3.9% |
Similar Demographics by In Labor Force | Age 25-29
Demographics Similar to Czechs by In Labor Force | Age 25-29
In terms of in labor force | age 25-29, the demographic groups most similar to Czechs are Turkish (85.6%, a difference of 0.020%), Macedonian (85.7%, a difference of 0.030%), Immigrants from Sierra Leone (85.7%, a difference of 0.030%), Italian (85.6%, a difference of 0.030%), and Immigrants from India (85.7%, a difference of 0.040%).
| Demographics | Rating | Rank | In Labor Force | Age 25-29 |
| Croatians | 99.9 /100 | #39 | Exceptional 85.8% |
| Immigrants | Albania | 99.9 /100 | #40 | Exceptional 85.7% |
| Immigrants | Greece | 99.9 /100 | #41 | Exceptional 85.7% |
| Immigrants | Eritrea | 99.9 /100 | #42 | Exceptional 85.7% |
| Immigrants | India | 99.9 /100 | #43 | Exceptional 85.7% |
| Macedonians | 99.9 /100 | #44 | Exceptional 85.7% |
| Immigrants | Sierra Leone | 99.9 /100 | #45 | Exceptional 85.7% |
| Czechs | 99.8 /100 | #46 | Exceptional 85.6% |
| Turks | 99.8 /100 | #47 | Exceptional 85.6% |
| Italians | 99.8 /100 | #48 | Exceptional 85.6% |
| Swedes | 99.8 /100 | #49 | Exceptional 85.6% |
| Yugoslavians | 99.8 /100 | #50 | Exceptional 85.6% |
| Immigrants | Latvia | 99.8 /100 | #51 | Exceptional 85.6% |
| Immigrants | Poland | 99.7 /100 | #52 | Exceptional 85.6% |
| Belgians | 99.7 /100 | #53 | Exceptional 85.5% |
Demographics Similar to Indians (Asian) by In Labor Force | Age 25-29
In terms of in labor force | age 25-29, the demographic groups most similar to Indians (Asian) are Immigrants from Sri Lanka (84.7%, a difference of 0.0%), French (84.7%, a difference of 0.0%), Colombian (84.7%, a difference of 0.010%), Immigrants from Pakistan (84.7%, a difference of 0.010%), and Immigrants from Taiwan (84.7%, a difference of 0.010%).
| Demographics | Rating | Rank | In Labor Force | Age 25-29 |
| Immigrants | England | 65.2 /100 | #148 | Good 84.7% |
| Peruvians | 64.7 /100 | #149 | Good 84.7% |
| Swiss | 64.7 /100 | #150 | Good 84.7% |
| Colombians | 62.8 /100 | #151 | Good 84.7% |
| Immigrants | Pakistan | 62.7 /100 | #152 | Good 84.7% |
| Immigrants | Taiwan | 62.2 /100 | #153 | Good 84.7% |
| Immigrants | Sri Lanka | 61.7 /100 | #154 | Good 84.7% |
| Indians (Asian) | 61.6 /100 | #155 | Good 84.7% |
| French | 61.0 /100 | #156 | Good 84.7% |
| British | 60.4 /100 | #157 | Good 84.7% |
| Immigrants | Ghana | 60.2 /100 | #158 | Good 84.7% |
| Immigrants | Western Africa | 60.1 /100 | #159 | Good 84.7% |
| Immigrants | Peru | 58.6 /100 | #160 | Average 84.7% |
| Canadians | 58.5 /100 | #161 | Average 84.7% |
| Immigrants | Colombia | 58.3 /100 | #162 | Average 84.7% |