Czechoslovakian vs Immigrants from Fiji In Labor Force | Age 20-64
COMPARE
Czechoslovakian
Immigrants from Fiji
In Labor Force | Age 20-64
In Labor Force | Age 20-64 Comparison
Czechoslovakians
Immigrants from Fiji
79.5%
IN LABOR FORCE | AGE 20-64
44.3/ 100
METRIC RATING
178th/ 347
METRIC RANK
78.6%
IN LABOR FORCE | AGE 20-64
0.3/ 100
METRIC RATING
260th/ 347
METRIC RANK
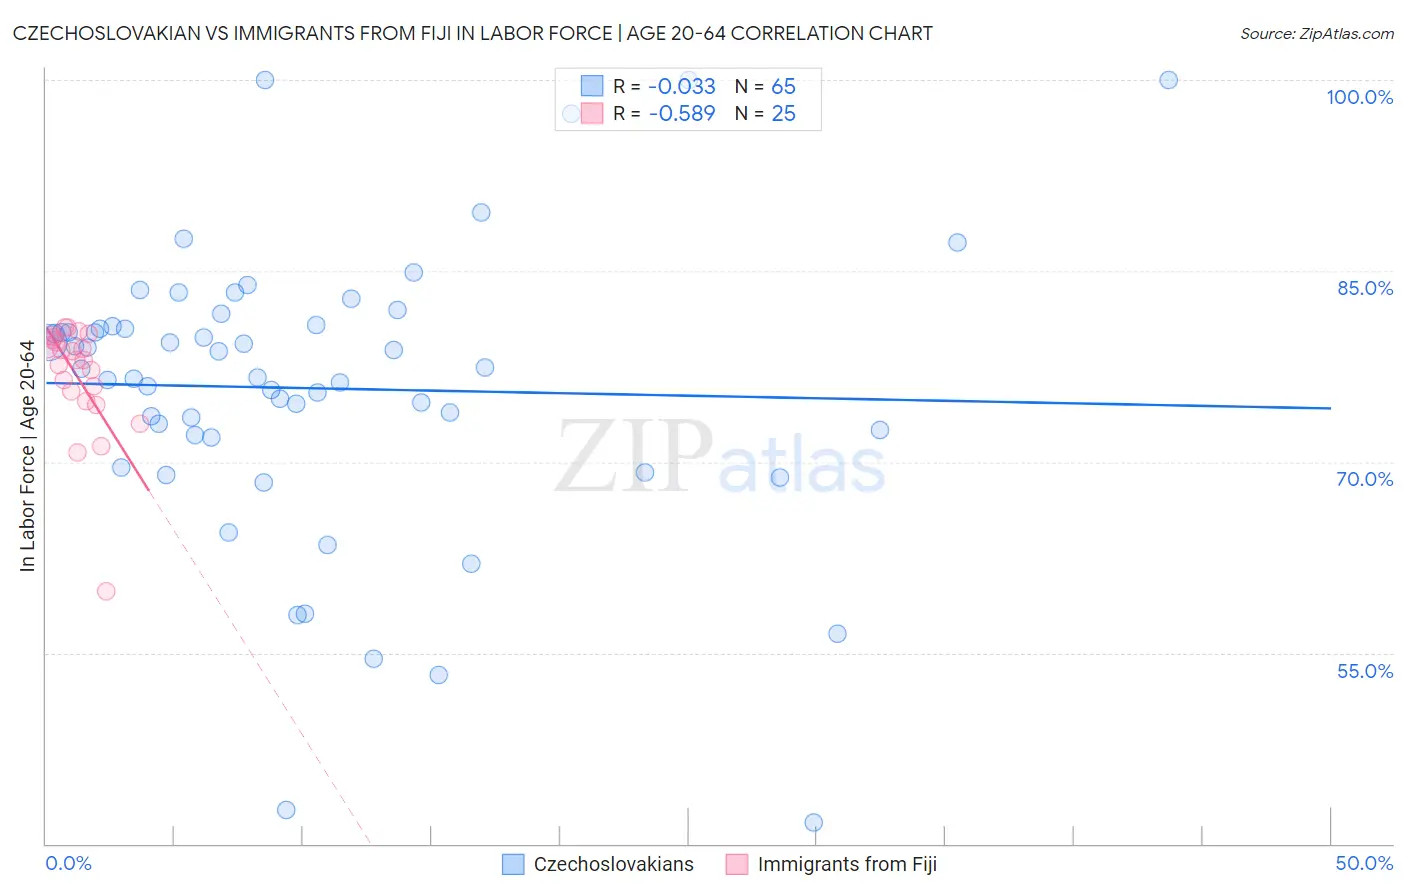
Czechoslovakian vs Immigrants from Fiji In Labor Force | Age 20-64 Correlation Chart
The statistical analysis conducted on geographies consisting of 368,672,704 people shows no correlation between the proportion of Czechoslovakians and labor force participation rate among population between the ages 20 and 64 in the United States with a correlation coefficient (R) of -0.033 and weighted average of 79.5%. Similarly, the statistical analysis conducted on geographies consisting of 93,756,016 people shows a substantial negative correlation between the proportion of Immigrants from Fiji and labor force participation rate among population between the ages 20 and 64 in the United States with a correlation coefficient (R) of -0.589 and weighted average of 78.6%, a difference of 1.2%.
In Labor Force | Age 20-64 Correlation Summary
| Measurement | Czechoslovakian | Immigrants from Fiji |
| Minimum | 41.7% | 59.8% |
| Maximum | 100.0% | 80.6% |
| Range | 58.3% | 20.8% |
| Mean | 75.8% | 76.7% |
| Median | 77.3% | 78.0% |
| Interquartile 25% (IQ1) | 72.0% | 75.2% |
| Interquartile 75% (IQ3) | 80.7% | 79.7% |
| Interquartile Range (IQR) | 8.7% | 4.5% |
| Standard Deviation (Sample) | 11.4% | 4.5% |
| Standard Deviation (Population) | 11.3% | 4.4% |
Similar Demographics by In Labor Force | Age 20-64
Demographics Similar to Czechoslovakians by In Labor Force | Age 20-64
In terms of in labor force | age 20-64, the demographic groups most similar to Czechoslovakians are Cuban (79.5%, a difference of 0.010%), Australian (79.5%, a difference of 0.010%), Immigrants from Netherlands (79.5%, a difference of 0.010%), Armenian (79.5%, a difference of 0.020%), and Salvadoran (79.5%, a difference of 0.030%).
| Demographics | Rating | Rank | In Labor Force | Age 20-64 |
| Immigrants | Switzerland | 53.3 /100 | #171 | Average 79.6% |
| Immigrants | Belgium | 53.1 /100 | #172 | Average 79.6% |
| Immigrants | Scotland | 52.4 /100 | #173 | Average 79.6% |
| Syrians | 50.0 /100 | #174 | Average 79.6% |
| Cubans | 46.1 /100 | #175 | Average 79.5% |
| Australians | 46.0 /100 | #176 | Average 79.5% |
| Immigrants | Netherlands | 45.2 /100 | #177 | Average 79.5% |
| Czechoslovakians | 44.3 /100 | #178 | Average 79.5% |
| Armenians | 41.4 /100 | #179 | Average 79.5% |
| Salvadorans | 41.0 /100 | #180 | Average 79.5% |
| Immigrants | Saudi Arabia | 37.7 /100 | #181 | Fair 79.5% |
| Malaysians | 37.1 /100 | #182 | Fair 79.5% |
| Immigrants | Hungary | 36.8 /100 | #183 | Fair 79.5% |
| Finns | 35.9 /100 | #184 | Fair 79.5% |
| Israelis | 34.7 /100 | #185 | Fair 79.5% |
Demographics Similar to Immigrants from Fiji by In Labor Force | Age 20-64
In terms of in labor force | age 20-64, the demographic groups most similar to Immigrants from Fiji are Tsimshian (78.7%, a difference of 0.070%), Guatemalan (78.7%, a difference of 0.11%), Immigrants from Guatemala (78.7%, a difference of 0.11%), White/Caucasian (78.5%, a difference of 0.11%), and Hawaiian (78.7%, a difference of 0.13%).
| Demographics | Rating | Rank | In Labor Force | Age 20-64 |
| Basques | 0.5 /100 | #253 | Tragic 78.7% |
| Immigrants | Lebanon | 0.5 /100 | #254 | Tragic 78.7% |
| Hawaiians | 0.5 /100 | #255 | Tragic 78.7% |
| Celtics | 0.5 /100 | #256 | Tragic 78.7% |
| Guatemalans | 0.4 /100 | #257 | Tragic 78.7% |
| Immigrants | Guatemala | 0.4 /100 | #258 | Tragic 78.7% |
| Tsimshian | 0.4 /100 | #259 | Tragic 78.7% |
| Immigrants | Fiji | 0.3 /100 | #260 | Tragic 78.6% |
| Whites/Caucasians | 0.2 /100 | #261 | Tragic 78.5% |
| Fijians | 0.1 /100 | #262 | Tragic 78.4% |
| Pennsylvania Germans | 0.1 /100 | #263 | Tragic 78.4% |
| Spaniards | 0.1 /100 | #264 | Tragic 78.4% |
| British West Indians | 0.1 /100 | #265 | Tragic 78.4% |
| Bahamians | 0.1 /100 | #266 | Tragic 78.4% |
| U.S. Virgin Islanders | 0.1 /100 | #267 | Tragic 78.4% |