Czechoslovakian vs Moroccan In Labor Force | Age 30-34
COMPARE
Czechoslovakian
Moroccan
In Labor Force | Age 30-34
In Labor Force | Age 30-34 Comparison
Czechoslovakians
Moroccans
84.8%
IN LABOR FORCE | AGE 30-34
63.0/ 100
METRIC RATING
159th/ 347
METRIC RANK
84.6%
IN LABOR FORCE | AGE 30-34
40.3/ 100
METRIC RATING
181st/ 347
METRIC RANK
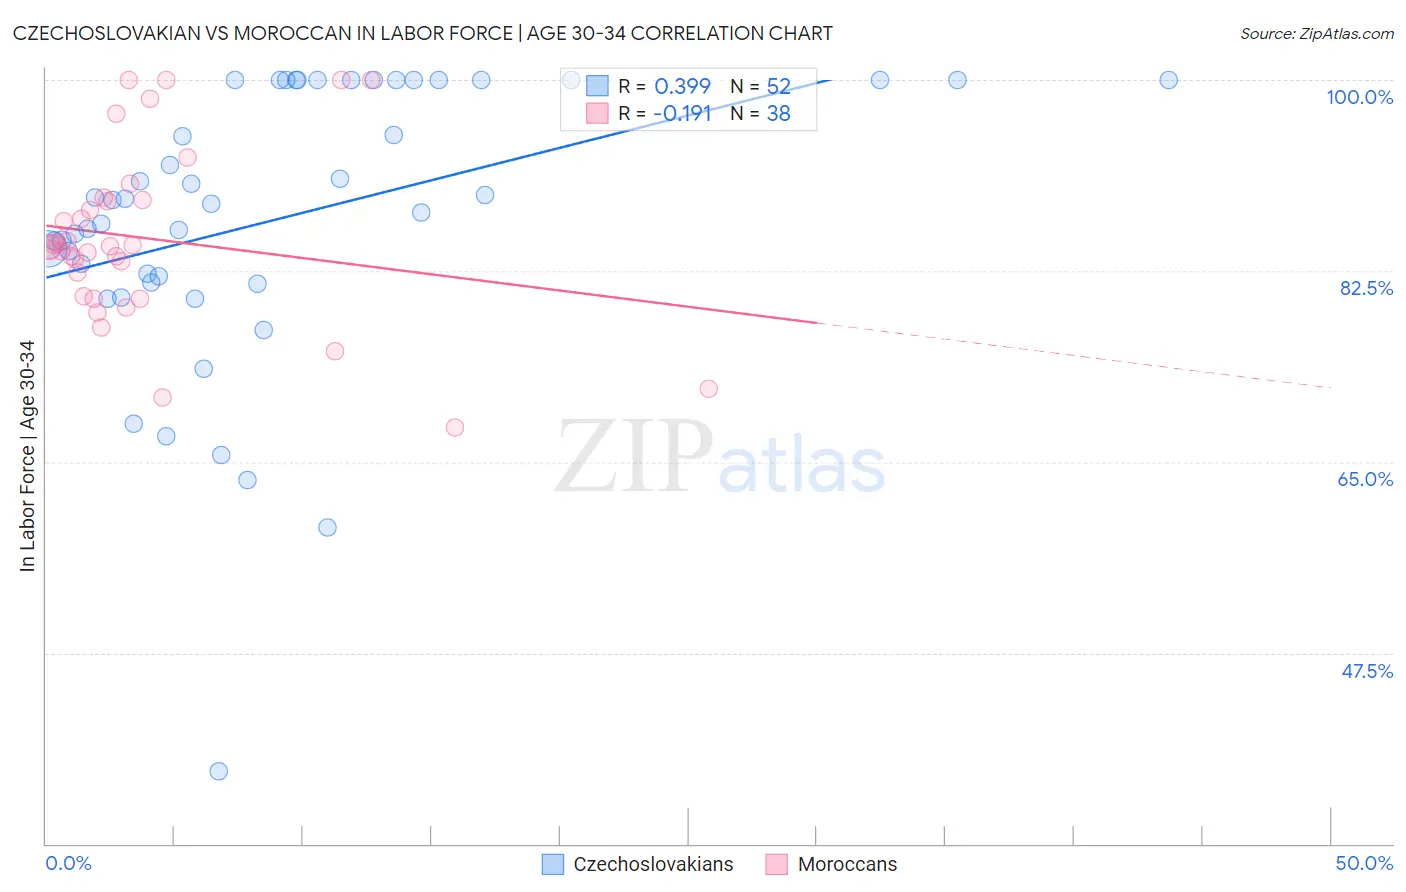
Czechoslovakian vs Moroccan In Labor Force | Age 30-34 Correlation Chart
The statistical analysis conducted on geographies consisting of 368,454,480 people shows a mild positive correlation between the proportion of Czechoslovakians and labor force participation rate among population between the ages 30 and 34 in the United States with a correlation coefficient (R) of 0.399 and weighted average of 84.8%. Similarly, the statistical analysis conducted on geographies consisting of 201,755,147 people shows a poor negative correlation between the proportion of Moroccans and labor force participation rate among population between the ages 30 and 34 in the United States with a correlation coefficient (R) of -0.191 and weighted average of 84.6%, a difference of 0.16%.
In Labor Force | Age 30-34 Correlation Summary
| Measurement | Czechoslovakian | Moroccan |
| Minimum | 36.7% | 68.1% |
| Maximum | 100.0% | 100.0% |
| Range | 63.3% | 31.9% |
| Mean | 87.2% | 85.5% |
| Median | 88.9% | 84.7% |
| Interquartile 25% (IQ1) | 81.7% | 80.2% |
| Interquartile 75% (IQ3) | 100.0% | 89.0% |
| Interquartile Range (IQR) | 18.3% | 8.8% |
| Standard Deviation (Sample) | 13.0% | 8.0% |
| Standard Deviation (Population) | 12.8% | 7.9% |
Similar Demographics by In Labor Force | Age 30-34
Demographics Similar to Czechoslovakians by In Labor Force | Age 30-34
In terms of in labor force | age 30-34, the demographic groups most similar to Czechoslovakians are Immigrants from Armenia (84.8%, a difference of 0.010%), Peruvian (84.8%, a difference of 0.020%), Pakistani (84.7%, a difference of 0.020%), Immigrants from Cambodia (84.7%, a difference of 0.020%), and French Canadian (84.8%, a difference of 0.030%).
| Demographics | Rating | Rank | In Labor Force | Age 30-34 |
| Romanians | 73.5 /100 | #152 | Good 84.8% |
| Syrians | 70.1 /100 | #153 | Good 84.8% |
| Northern Europeans | 70.0 /100 | #154 | Good 84.8% |
| Immigrants | Sudan | 69.5 /100 | #155 | Good 84.8% |
| French Canadians | 67.3 /100 | #156 | Good 84.8% |
| Peruvians | 65.9 /100 | #157 | Good 84.8% |
| Immigrants | Armenia | 64.7 /100 | #158 | Good 84.8% |
| Czechoslovakians | 63.0 /100 | #159 | Good 84.8% |
| Pakistanis | 60.8 /100 | #160 | Good 84.7% |
| Immigrants | Cambodia | 60.7 /100 | #161 | Good 84.7% |
| South Americans | 58.7 /100 | #162 | Average 84.7% |
| Immigrants | Uruguay | 57.4 /100 | #163 | Average 84.7% |
| Icelanders | 56.8 /100 | #164 | Average 84.7% |
| Immigrants | Western Europe | 56.7 /100 | #165 | Average 84.7% |
| Afghans | 55.2 /100 | #166 | Average 84.7% |
Demographics Similar to Moroccans by In Labor Force | Age 30-34
In terms of in labor force | age 30-34, the demographic groups most similar to Moroccans are Immigrants from Netherlands (84.6%, a difference of 0.010%), Immigrants from Nigeria (84.6%, a difference of 0.020%), Okinawan (84.6%, a difference of 0.030%), Barbadian (84.6%, a difference of 0.030%), and Immigrants from Canada (84.6%, a difference of 0.040%).
| Demographics | Rating | Rank | In Labor Force | Age 30-34 |
| Finns | 50.0 /100 | #174 | Average 84.7% |
| Immigrants | South America | 50.0 /100 | #175 | Average 84.7% |
| Immigrants | Uzbekistan | 49.1 /100 | #176 | Average 84.7% |
| Laotians | 46.9 /100 | #177 | Average 84.7% |
| Okinawans | 44.1 /100 | #178 | Average 84.6% |
| Immigrants | Nigeria | 42.5 /100 | #179 | Average 84.6% |
| Immigrants | Netherlands | 42.1 /100 | #180 | Average 84.6% |
| Moroccans | 40.3 /100 | #181 | Average 84.6% |
| Barbadians | 36.7 /100 | #182 | Fair 84.6% |
| Immigrants | Canada | 35.0 /100 | #183 | Fair 84.6% |
| Immigrants | North America | 33.3 /100 | #184 | Fair 84.6% |
| Immigrants | Philippines | 31.5 /100 | #185 | Fair 84.6% |
| Immigrants | Congo | 29.7 /100 | #186 | Fair 84.6% |
| Costa Ricans | 29.6 /100 | #187 | Fair 84.6% |
| Taiwanese | 29.4 /100 | #188 | Fair 84.6% |