Czechoslovakian vs Immigrants from Portugal In Labor Force | Age 30-34
COMPARE
Czechoslovakian
Immigrants from Portugal
In Labor Force | Age 30-34
In Labor Force | Age 30-34 Comparison
Czechoslovakians
Immigrants from Portugal
84.8%
IN LABOR FORCE | AGE 30-34
63.0/ 100
METRIC RATING
159th/ 347
METRIC RANK
84.0%
IN LABOR FORCE | AGE 30-34
1.2/ 100
METRIC RATING
241st/ 347
METRIC RANK
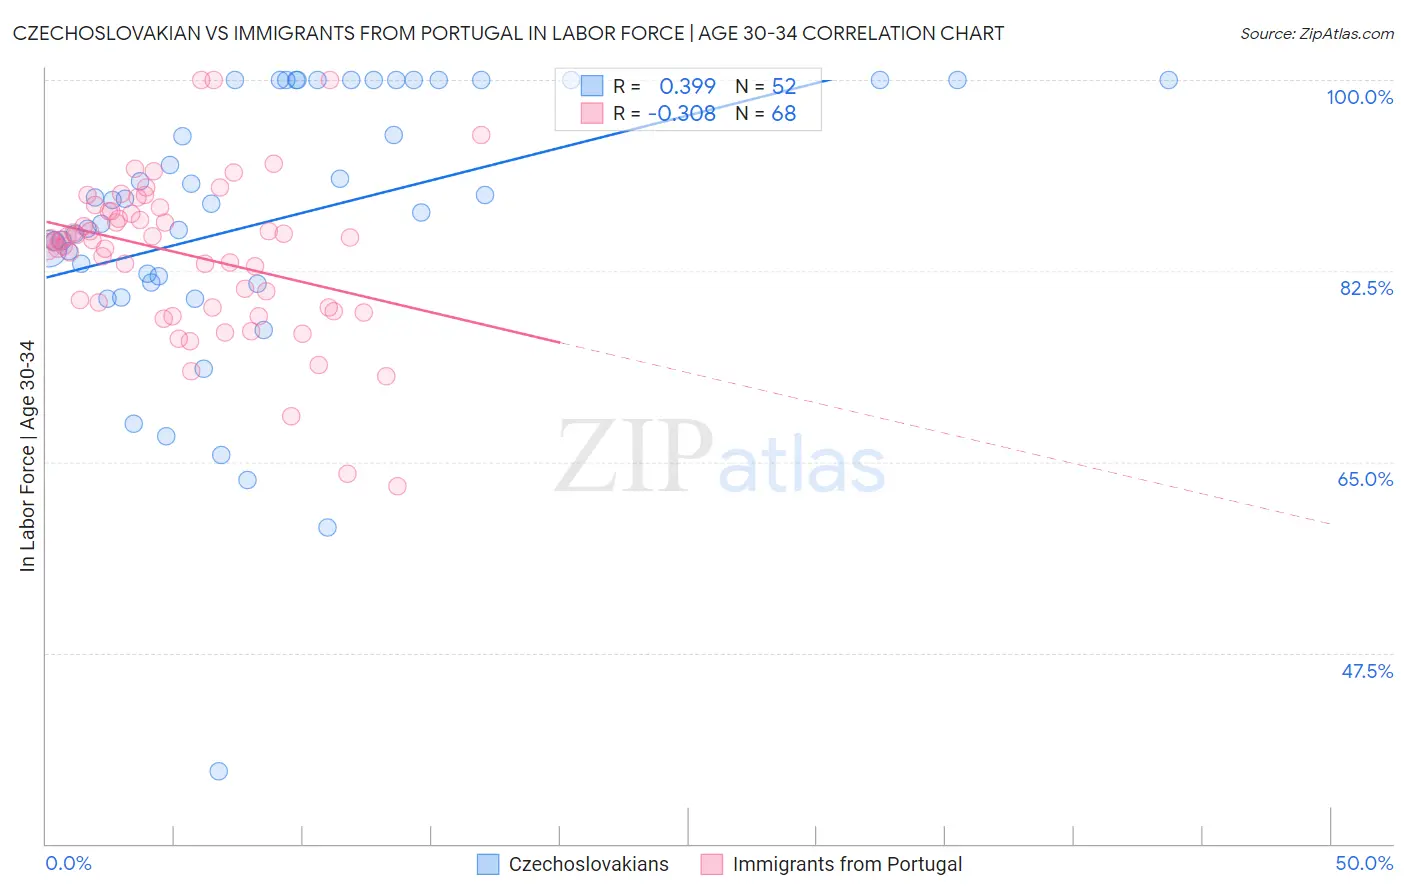
Czechoslovakian vs Immigrants from Portugal In Labor Force | Age 30-34 Correlation Chart
The statistical analysis conducted on geographies consisting of 368,454,480 people shows a mild positive correlation between the proportion of Czechoslovakians and labor force participation rate among population between the ages 30 and 34 in the United States with a correlation coefficient (R) of 0.399 and weighted average of 84.8%. Similarly, the statistical analysis conducted on geographies consisting of 174,756,515 people shows a mild negative correlation between the proportion of Immigrants from Portugal and labor force participation rate among population between the ages 30 and 34 in the United States with a correlation coefficient (R) of -0.308 and weighted average of 84.0%, a difference of 0.88%.
In Labor Force | Age 30-34 Correlation Summary
| Measurement | Czechoslovakian | Immigrants from Portugal |
| Minimum | 36.7% | 62.8% |
| Maximum | 100.0% | 100.0% |
| Range | 63.3% | 37.2% |
| Mean | 87.2% | 84.0% |
| Median | 88.9% | 85.3% |
| Interquartile 25% (IQ1) | 81.7% | 79.2% |
| Interquartile 75% (IQ3) | 100.0% | 88.0% |
| Interquartile Range (IQR) | 18.3% | 8.8% |
| Standard Deviation (Sample) | 13.0% | 7.2% |
| Standard Deviation (Population) | 12.8% | 7.1% |
Similar Demographics by In Labor Force | Age 30-34
Demographics Similar to Czechoslovakians by In Labor Force | Age 30-34
In terms of in labor force | age 30-34, the demographic groups most similar to Czechoslovakians are Immigrants from Armenia (84.8%, a difference of 0.010%), Peruvian (84.8%, a difference of 0.020%), Pakistani (84.7%, a difference of 0.020%), Immigrants from Cambodia (84.7%, a difference of 0.020%), and French Canadian (84.8%, a difference of 0.030%).
| Demographics | Rating | Rank | In Labor Force | Age 30-34 |
| Romanians | 73.5 /100 | #152 | Good 84.8% |
| Syrians | 70.1 /100 | #153 | Good 84.8% |
| Northern Europeans | 70.0 /100 | #154 | Good 84.8% |
| Immigrants | Sudan | 69.5 /100 | #155 | Good 84.8% |
| French Canadians | 67.3 /100 | #156 | Good 84.8% |
| Peruvians | 65.9 /100 | #157 | Good 84.8% |
| Immigrants | Armenia | 64.7 /100 | #158 | Good 84.8% |
| Czechoslovakians | 63.0 /100 | #159 | Good 84.8% |
| Pakistanis | 60.8 /100 | #160 | Good 84.7% |
| Immigrants | Cambodia | 60.7 /100 | #161 | Good 84.7% |
| South Americans | 58.7 /100 | #162 | Average 84.7% |
| Immigrants | Uruguay | 57.4 /100 | #163 | Average 84.7% |
| Icelanders | 56.8 /100 | #164 | Average 84.7% |
| Immigrants | Western Europe | 56.7 /100 | #165 | Average 84.7% |
| Afghans | 55.2 /100 | #166 | Average 84.7% |
Demographics Similar to Immigrants from Portugal by In Labor Force | Age 30-34
In terms of in labor force | age 30-34, the demographic groups most similar to Immigrants from Portugal are Immigrants from Oceania (84.0%, a difference of 0.010%), English (84.0%, a difference of 0.020%), Venezuelan (84.0%, a difference of 0.020%), Immigrants from Caribbean (84.0%, a difference of 0.020%), and Celtic (84.1%, a difference of 0.030%).
| Demographics | Rating | Rank | In Labor Force | Age 30-34 |
| Haitians | 1.8 /100 | #234 | Tragic 84.1% |
| French American Indians | 1.7 /100 | #235 | Tragic 84.1% |
| U.S. Virgin Islanders | 1.5 /100 | #236 | Tragic 84.1% |
| Celtics | 1.4 /100 | #237 | Tragic 84.1% |
| Immigrants | Barbados | 1.4 /100 | #238 | Tragic 84.0% |
| English | 1.4 /100 | #239 | Tragic 84.0% |
| Venezuelans | 1.3 /100 | #240 | Tragic 84.0% |
| Immigrants | Portugal | 1.2 /100 | #241 | Tragic 84.0% |
| Immigrants | Oceania | 1.1 /100 | #242 | Tragic 84.0% |
| Immigrants | Caribbean | 1.1 /100 | #243 | Tragic 84.0% |
| Basques | 0.9 /100 | #244 | Tragic 84.0% |
| Immigrants | Venezuela | 0.9 /100 | #245 | Tragic 84.0% |
| Central Americans | 0.9 /100 | #246 | Tragic 84.0% |
| British West Indians | 0.8 /100 | #247 | Tragic 84.0% |
| Portuguese | 0.8 /100 | #248 | Tragic 84.0% |