Czechoslovakian vs Immigrants from Lebanon In Labor Force | Age 30-34
COMPARE
Czechoslovakian
Immigrants from Lebanon
In Labor Force | Age 30-34
In Labor Force | Age 30-34 Comparison
Czechoslovakians
Immigrants from Lebanon
84.8%
IN LABOR FORCE | AGE 30-34
63.0/ 100
METRIC RATING
159th/ 347
METRIC RANK
83.9%
IN LABOR FORCE | AGE 30-34
0.4/ 100
METRIC RATING
256th/ 347
METRIC RANK
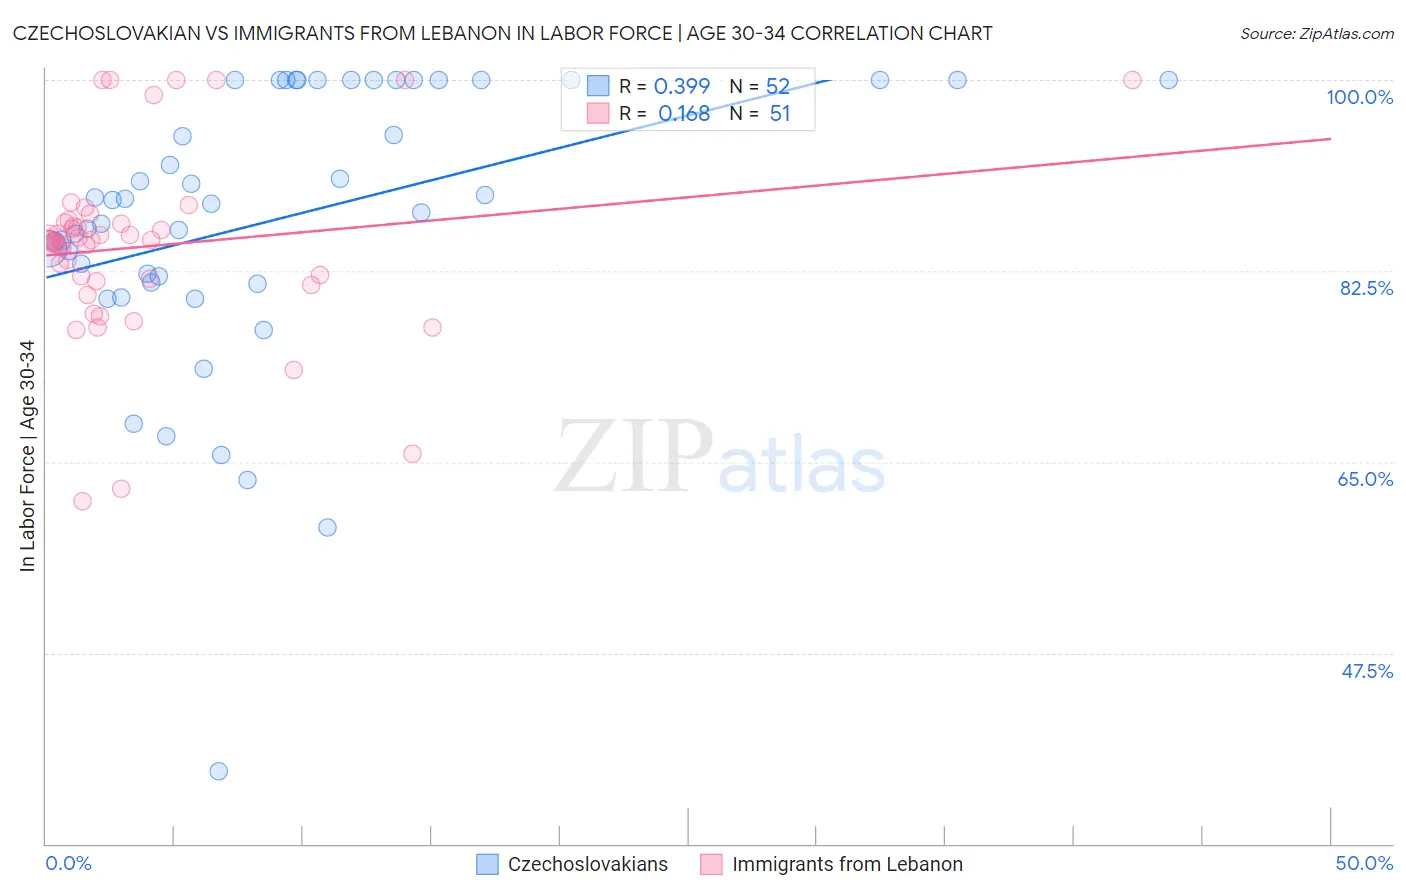
Czechoslovakian vs Immigrants from Lebanon In Labor Force | Age 30-34 Correlation Chart
The statistical analysis conducted on geographies consisting of 368,454,480 people shows a mild positive correlation between the proportion of Czechoslovakians and labor force participation rate among population between the ages 30 and 34 in the United States with a correlation coefficient (R) of 0.399 and weighted average of 84.8%. Similarly, the statistical analysis conducted on geographies consisting of 217,118,980 people shows a poor positive correlation between the proportion of Immigrants from Lebanon and labor force participation rate among population between the ages 30 and 34 in the United States with a correlation coefficient (R) of 0.168 and weighted average of 83.9%, a difference of 1.1%.
In Labor Force | Age 30-34 Correlation Summary
| Measurement | Czechoslovakian | Immigrants from Lebanon |
| Minimum | 36.7% | 61.4% |
| Maximum | 100.0% | 100.0% |
| Range | 63.3% | 38.6% |
| Mean | 87.2% | 84.8% |
| Median | 88.9% | 85.3% |
| Interquartile 25% (IQ1) | 81.7% | 81.5% |
| Interquartile 75% (IQ3) | 100.0% | 87.0% |
| Interquartile Range (IQR) | 18.3% | 5.5% |
| Standard Deviation (Sample) | 13.0% | 8.5% |
| Standard Deviation (Population) | 12.8% | 8.4% |
Similar Demographics by In Labor Force | Age 30-34
Demographics Similar to Czechoslovakians by In Labor Force | Age 30-34
In terms of in labor force | age 30-34, the demographic groups most similar to Czechoslovakians are Immigrants from Armenia (84.8%, a difference of 0.010%), Peruvian (84.8%, a difference of 0.020%), Pakistani (84.7%, a difference of 0.020%), Immigrants from Cambodia (84.7%, a difference of 0.020%), and French Canadian (84.8%, a difference of 0.030%).
| Demographics | Rating | Rank | In Labor Force | Age 30-34 |
| Romanians | 73.5 /100 | #152 | Good 84.8% |
| Syrians | 70.1 /100 | #153 | Good 84.8% |
| Northern Europeans | 70.0 /100 | #154 | Good 84.8% |
| Immigrants | Sudan | 69.5 /100 | #155 | Good 84.8% |
| French Canadians | 67.3 /100 | #156 | Good 84.8% |
| Peruvians | 65.9 /100 | #157 | Good 84.8% |
| Immigrants | Armenia | 64.7 /100 | #158 | Good 84.8% |
| Czechoslovakians | 63.0 /100 | #159 | Good 84.8% |
| Pakistanis | 60.8 /100 | #160 | Good 84.7% |
| Immigrants | Cambodia | 60.7 /100 | #161 | Good 84.7% |
| South Americans | 58.7 /100 | #162 | Average 84.7% |
| Immigrants | Uruguay | 57.4 /100 | #163 | Average 84.7% |
| Icelanders | 56.8 /100 | #164 | Average 84.7% |
| Immigrants | Western Europe | 56.7 /100 | #165 | Average 84.7% |
| Afghans | 55.2 /100 | #166 | Average 84.7% |
Demographics Similar to Immigrants from Lebanon by In Labor Force | Age 30-34
In terms of in labor force | age 30-34, the demographic groups most similar to Immigrants from Lebanon are Iraqi (83.8%, a difference of 0.010%), White/Caucasian (83.9%, a difference of 0.040%), Honduran (83.8%, a difference of 0.040%), Scotch-Irish (83.8%, a difference of 0.050%), and Immigrants from St. Vincent and the Grenadines (83.9%, a difference of 0.060%).
| Demographics | Rating | Rank | In Labor Force | Age 30-34 |
| Immigrants | Dominica | 0.7 /100 | #249 | Tragic 84.0% |
| Immigrants | Iraq | 0.7 /100 | #250 | Tragic 83.9% |
| Nicaraguans | 0.6 /100 | #251 | Tragic 83.9% |
| Bahamians | 0.6 /100 | #252 | Tragic 83.9% |
| Immigrants | Nicaragua | 0.6 /100 | #253 | Tragic 83.9% |
| Immigrants | St. Vincent and the Grenadines | 0.5 /100 | #254 | Tragic 83.9% |
| Whites/Caucasians | 0.5 /100 | #255 | Tragic 83.9% |
| Immigrants | Lebanon | 0.4 /100 | #256 | Tragic 83.9% |
| Iraqis | 0.3 /100 | #257 | Tragic 83.8% |
| Hondurans | 0.3 /100 | #258 | Tragic 83.8% |
| Scotch-Irish | 0.3 /100 | #259 | Tragic 83.8% |
| Immigrants | Dominican Republic | 0.3 /100 | #260 | Tragic 83.8% |
| Guyanese | 0.3 /100 | #261 | Tragic 83.8% |
| Dominicans | 0.2 /100 | #262 | Tragic 83.8% |
| Immigrants | Guyana | 0.2 /100 | #263 | Tragic 83.8% |