Ukrainian vs Immigrants from Italy In Labor Force | Age 20-24
COMPARE
Ukrainian
Immigrants from Italy
In Labor Force | Age 20-24
In Labor Force | Age 20-24 Comparison
Ukrainians
Immigrants from Italy
75.9%
IN LABOR FORCE | AGE 20-24
95.7/ 100
METRIC RATING
111th/ 347
METRIC RANK
74.6%
IN LABOR FORCE | AGE 20-24
17.6/ 100
METRIC RATING
204th/ 347
METRIC RANK
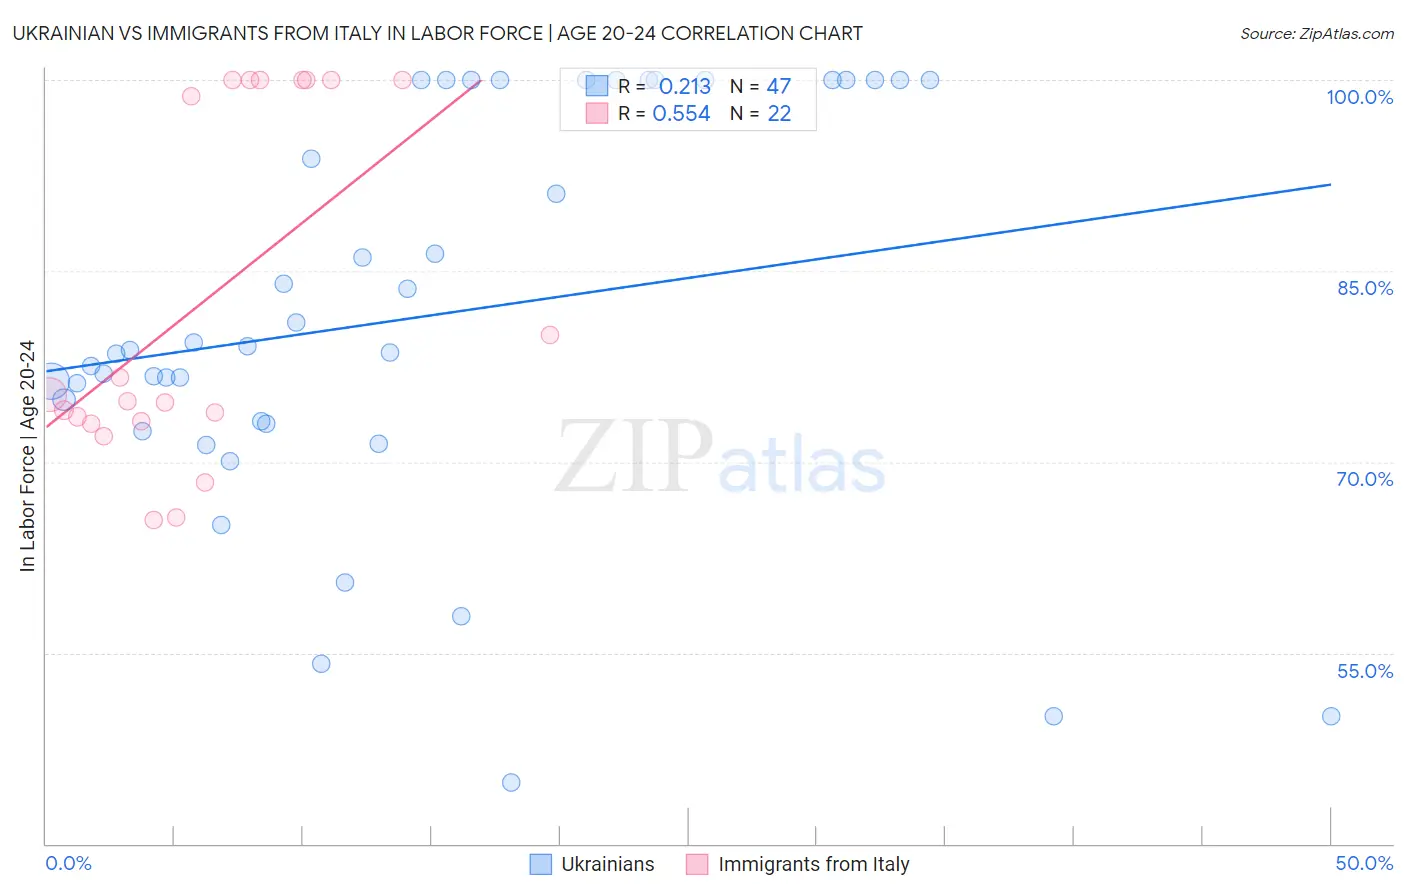
Ukrainian vs Immigrants from Italy In Labor Force | Age 20-24 Correlation Chart
The statistical analysis conducted on geographies consisting of 448,349,604 people shows a weak positive correlation between the proportion of Ukrainians and labor force participation rate among population between the ages 20 and 24 in the United States with a correlation coefficient (R) of 0.213 and weighted average of 75.9%. Similarly, the statistical analysis conducted on geographies consisting of 324,060,092 people shows a substantial positive correlation between the proportion of Immigrants from Italy and labor force participation rate among population between the ages 20 and 24 in the United States with a correlation coefficient (R) of 0.554 and weighted average of 74.6%, a difference of 1.7%.
In Labor Force | Age 20-24 Correlation Summary
| Measurement | Ukrainian | Immigrants from Italy |
| Minimum | 44.8% | 65.4% |
| Maximum | 100.0% | 100.0% |
| Range | 55.2% | 34.6% |
| Mean | 81.4% | 82.7% |
| Median | 78.8% | 75.0% |
| Interquartile 25% (IQ1) | 73.0% | 73.2% |
| Interquartile 75% (IQ3) | 100.0% | 100.0% |
| Interquartile Range (IQR) | 27.0% | 26.8% |
| Standard Deviation (Sample) | 15.6% | 13.6% |
| Standard Deviation (Population) | 15.5% | 13.3% |
Similar Demographics by In Labor Force | Age 20-24
Demographics Similar to Ukrainians by In Labor Force | Age 20-24
In terms of in labor force | age 20-24, the demographic groups most similar to Ukrainians are Cherokee (75.9%, a difference of 0.010%), Immigrants from Morocco (75.9%, a difference of 0.010%), Immigrants from Canada (75.9%, a difference of 0.010%), Immigrants from Netherlands (75.9%, a difference of 0.040%), and Immigrants from Zimbabwe (75.9%, a difference of 0.050%).
| Demographics | Rating | Rank | In Labor Force | Age 20-24 |
| Macedonians | 97.2 /100 | #104 | Exceptional 76.0% |
| Immigrants | Nepal | 97.2 /100 | #105 | Exceptional 76.0% |
| Immigrants | Uganda | 97.1 /100 | #106 | Exceptional 76.0% |
| Greeks | 96.9 /100 | #107 | Exceptional 76.0% |
| Iraqis | 96.6 /100 | #108 | Exceptional 76.0% |
| Cherokee | 95.8 /100 | #109 | Exceptional 75.9% |
| Immigrants | Morocco | 95.8 /100 | #110 | Exceptional 75.9% |
| Ukrainians | 95.7 /100 | #111 | Exceptional 75.9% |
| Immigrants | Canada | 95.6 /100 | #112 | Exceptional 75.9% |
| Immigrants | Netherlands | 95.3 /100 | #113 | Exceptional 75.9% |
| Immigrants | Zimbabwe | 95.1 /100 | #114 | Exceptional 75.9% |
| Alaska Natives | 95.1 /100 | #115 | Exceptional 75.9% |
| Immigrants | North America | 95.0 /100 | #116 | Exceptional 75.9% |
| Assyrians/Chaldeans/Syriacs | 94.9 /100 | #117 | Exceptional 75.9% |
| Spanish Americans | 94.8 /100 | #118 | Exceptional 75.8% |
Demographics Similar to Immigrants from Italy by In Labor Force | Age 20-24
In terms of in labor force | age 20-24, the demographic groups most similar to Immigrants from Italy are Inupiat (74.6%, a difference of 0.0%), Sioux (74.6%, a difference of 0.0%), Immigrants from Northern Africa (74.6%, a difference of 0.010%), Albanian (74.6%, a difference of 0.040%), and Immigrants from Uruguay (74.6%, a difference of 0.050%).
| Demographics | Rating | Rank | In Labor Force | Age 20-24 |
| Panamanians | 25.0 /100 | #197 | Fair 74.7% |
| Immigrants | Nigeria | 24.2 /100 | #198 | Fair 74.7% |
| Taiwanese | 23.2 /100 | #199 | Fair 74.7% |
| Nigerians | 21.9 /100 | #200 | Fair 74.7% |
| Choctaw | 21.4 /100 | #201 | Fair 74.7% |
| Moroccans | 20.4 /100 | #202 | Fair 74.7% |
| Immigrants | Northern Africa | 17.9 /100 | #203 | Poor 74.6% |
| Immigrants | Italy | 17.6 /100 | #204 | Poor 74.6% |
| Inupiat | 17.6 /100 | #205 | Poor 74.6% |
| Sioux | 17.5 /100 | #206 | Poor 74.6% |
| Albanians | 16.2 /100 | #207 | Poor 74.6% |
| Immigrants | Uruguay | 15.8 /100 | #208 | Poor 74.6% |
| Arabs | 15.8 /100 | #209 | Poor 74.6% |
| Uruguayans | 15.1 /100 | #210 | Poor 74.6% |
| Immigrants | Australia | 14.7 /100 | #211 | Poor 74.6% |