Immigrants from Asia vs Immigrants from Australia In Labor Force | Age 20-24

COMPARE

Immigrants from Asia
Race
Ancestry
AfghanAfricanAlaska NativeAlaskan AthabascanAlbanianAleutAlsatianAmericanApacheArabArapahoArgentineanArmenianAssyrian/Chaldean/SyriacAustralianAustrianBahamianBangladeshiBarbadianBasqueBelgianBelizeanBermudanBhutaneseBlackfeetBolivianBrazilianBritishBritish West IndianBulgarianBurmeseCajunCambodianCanadianCape VerdeanCarpatho RusynCelticCentral AmericanCentral American IndianCherokeeCheyenneChickasawChileanChineseChippewaChoctawColombianColvilleComancheCosta RicanCreeCreekCroatianCrowCubanCypriotCzechCzechoslovakianDanishDelawareDominicanDutchDutch West IndianEastern EuropeanEcuadorianEgyptianEnglishEstonianEthiopianEuropeanFijianFilipinoFinnishFrenchFrench American IndianFrench CanadianGermanGerman RussianGhanaianGreekGuamanian/ChamorroGuatemalanGuyaneseHaitianHmongHonduranHopiHoumaHungarianIcelanderIndian (Asian)IndonesianInupiatIranianIraqiIrishIroquoisIsraeliItalianJamaicanJapaneseJordanianKenyanKiowaKoreanLaotianLatvianLebaneseLiberianLithuanianLumbeeLuxembourgerMacedonianMalaysianMalteseMarshalleseMenomineeMexicanMexican American IndianMongolianMoroccanNative HawaiianNavajoNepaleseNew ZealanderNicaraguanNigerianNorthern EuropeanNorwegianOkinawanOsageOttawaPaiutePakistaniPalestinianPanamanianParaguayanPennsylvania GermanPeruvianPimaPolishPortuguesePotawatomiPuebloPuerto RicanPuget Sound SalishRomanianRussianSalvadoranSamoanScandinavianScotch-IrishScottishSeminoleSenegaleseSerbianShoshoneSierra LeoneanSiouxSlavicSlovakSloveneSomaliSouth AfricanSouth AmericanSouth American IndianSoviet UnionSpaniardSpanishSpanish AmericanSpanish American IndianSri LankanSubsaharan AfricanSudaneseSwedishSwissSyrianTaiwaneseThaiTlingit-HaidaTohono O'OdhamTonganTrinidadian and TobagonianTsimshianTurkishU.S. Virgin IslanderUgandanUkrainianUruguayanUteVenezuelanVietnameseWelshWest IndianYakamaYaquiYugoslavianYumanYup'ikZimbabwean
Immigration
NonimmigrantsImmigrantsAfghanistanAfricaAlbaniaArgentinaArmeniaAsiaAustriaBahamasBangladeshBarbadosBelarusBelgiumBelizeBoliviaBosnia and HerzegovinaBrazilBulgariaBurma/MyanmarCabo VerdeCambodiaCameroonCanadaCaribbeanCentral AmericaChileChinaColombiaCongoCosta RicaCroatiaCubaCzechoslovakiaDenmarkDominicaDominican RepublicEastern AfricaEastern AsiaEastern EuropeEcuadorEgyptEl SalvadorEnglandEritreaEthiopiaEuropeFijiFranceGermanyGhanaGreeceGrenadaGuatemalaGuyanaHaitiHondurasHong KongHungaryIndiaIndonesiaIranIraqIrelandIsraelItalyJamaicaJapanJordanKazakhstanKenyaKoreaKuwaitLaosLatin AmericaLatviaLebanonLiberiaLithuaniaMalaysiaMexicoMicronesiaMiddle AfricaMoldovaMoroccoNepalNetherlandsNicaraguaNigeriaNorth AmericaNorth MacedoniaNorthern AfricaNorthern EuropeNorwayOceaniaPakistanPanamaPeruPhilippinesPolandPortugalRomaniaRussiaSaudi ArabiaScotlandSenegalSerbiaSierra LeoneSingaporeSomaliaSouth AfricaSouth AmericaSouth Central AsiaSouth Eastern AsiaSouthern EuropeSpainSri LankaSt. Vincent and the GrenadinesSudanSwedenSwitzerlandSyriaTaiwanThailandTrinidad and TobagoTurkeyUgandaUkraineUruguayUzbekistanVenezuelaVietnamWest IndiesWestern AfricaWestern AsiaWestern EuropeYemenZaireZimbabweAzores
Immigrants from Australia
Race
Ancestry
AfghanAfricanAlaska NativeAlaskan AthabascanAlbanianAleutAlsatianAmericanApacheArabArapahoArgentineanArmenianAssyrian/Chaldean/SyriacAustralianAustrianBahamianBangladeshiBarbadianBasqueBelgianBelizeanBermudanBhutaneseBlackfeetBolivianBrazilianBritishBritish West IndianBulgarianBurmeseCajunCambodianCanadianCape VerdeanCarpatho RusynCelticCentral AmericanCentral American IndianCherokeeCheyenneChickasawChileanChineseChippewaChoctawColombianColvilleComancheCosta RicanCreeCreekCroatianCrowCubanCypriotCzechCzechoslovakianDanishDelawareDominicanDutchDutch West IndianEastern EuropeanEcuadorianEgyptianEnglishEstonianEthiopianEuropeanFijianFilipinoFinnishFrenchFrench American IndianFrench CanadianGermanGerman RussianGhanaianGreekGuamanian/ChamorroGuatemalanGuyaneseHaitianHmongHonduranHopiHoumaHungarianIcelanderIndian (Asian)IndonesianInupiatIranianIraqiIrishIroquoisIsraeliItalianJamaicanJapaneseJordanianKenyanKiowaKoreanLaotianLatvianLebaneseLiberianLithuanianLumbeeLuxembourgerMacedonianMalaysianMalteseMarshalleseMenomineeMexicanMexican American IndianMongolianMoroccanNative HawaiianNavajoNepaleseNew ZealanderNicaraguanNigerianNorthern EuropeanNorwegianOkinawanOsageOttawaPaiutePakistaniPalestinianPanamanianParaguayanPennsylvania GermanPeruvianPimaPolishPortuguesePotawatomiPuebloPuerto RicanPuget Sound SalishRomanianRussianSalvadoranSamoanScandinavianScotch-IrishScottishSeminoleSenegaleseSerbianShoshoneSierra LeoneanSiouxSlavicSlovakSloveneSomaliSouth AfricanSouth AmericanSouth American IndianSoviet UnionSpaniardSpanishSpanish AmericanSpanish American IndianSri LankanSubsaharan AfricanSudaneseSwedishSwissSyrianTaiwaneseThaiTlingit-HaidaTohono O'OdhamTonganTrinidadian and TobagonianTsimshianTurkishU.S. Virgin IslanderUgandanUkrainianUruguayanUteVenezuelanVietnameseWelshWest IndianYakamaYaquiYugoslavianYumanYup'ikZimbabwean
Immigration
NonimmigrantsImmigrantsAfghanistanAfricaAlbaniaArgentinaArmeniaAustraliaAustriaBahamasBangladeshBarbadosBelarusBelgiumBelizeBoliviaBosnia and HerzegovinaBrazilBulgariaBurma/MyanmarCabo VerdeCambodiaCameroonCanadaCaribbeanCentral AmericaChileChinaColombiaCongoCosta RicaCroatiaCubaCzechoslovakiaDenmarkDominicaDominican RepublicEastern AfricaEastern AsiaEastern EuropeEcuadorEgyptEl SalvadorEnglandEritreaEthiopiaEuropeFijiFranceGermanyGhanaGreeceGrenadaGuatemalaGuyanaHaitiHondurasHong KongHungaryIndiaIndonesiaIranIraqIrelandIsraelItalyJamaicaJapanJordanKazakhstanKenyaKoreaKuwaitLaosLatin AmericaLatviaLebanonLiberiaLithuaniaMalaysiaMexicoMicronesiaMiddle AfricaMoldovaMoroccoNepalNetherlandsNicaraguaNigeriaNorth AmericaNorth MacedoniaNorthern AfricaNorthern EuropeNorwayOceaniaPakistanPanamaPeruPhilippinesPolandPortugalRomaniaRussiaSaudi ArabiaScotlandSenegalSerbiaSierra LeoneSingaporeSomaliaSouth AfricaSouth AmericaSouth Central AsiaSouth Eastern AsiaSouthern EuropeSpainSri LankaSt. Vincent and the GrenadinesSudanSwedenSwitzerlandSyriaTaiwanThailandTrinidad and TobagoTurkeyUgandaUkraineUruguayUzbekistanVenezuelaVietnamWest IndiesWestern AfricaWestern AsiaWestern EuropeYemenZaireZimbabweAzores
In Labor Force | Age 20-24
Income
Poverty
Unemployment
Labor Participation
Family Structure
Vehicle Availability
Education Level
Disability

In Labor Force | Age 20-24 Comparison

Immigrants from Asia

Immigrants from Australia

Tragic
Poor
73.6%
IN LABOR FORCE | AGE 20-24
0.5/ 100
METRIC RATING
263rd/ 347
METRIC RANK
74.6%
IN LABOR FORCE | AGE 20-24
14.7/ 100
METRIC RATING
211th/ 347
METRIC RANK

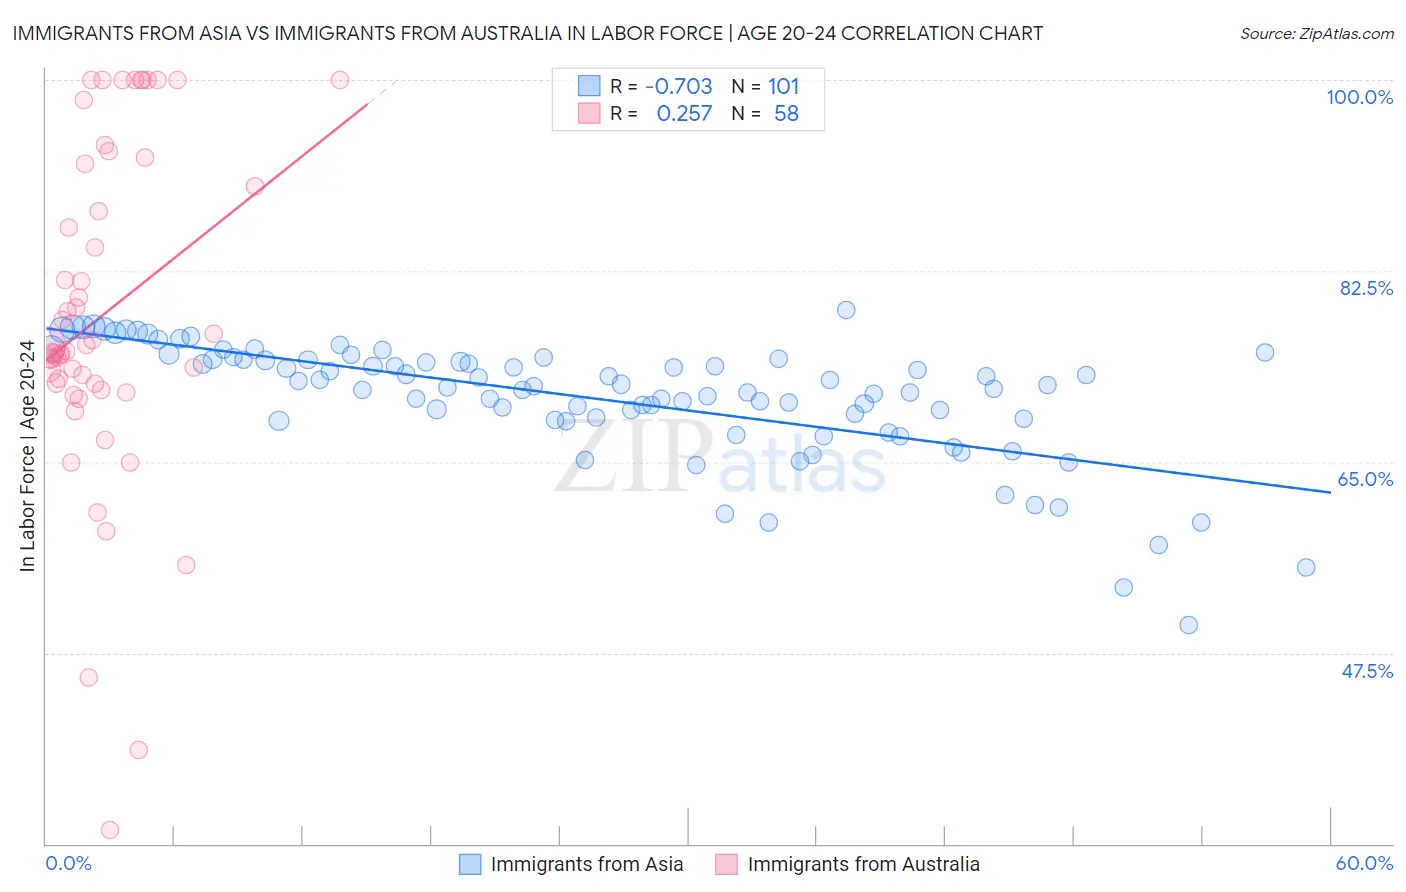
Immigrants from Asia vs Immigrants from Australia In Labor Force | Age 20-24 Correlation Chart

The statistical analysis conducted on geographies consisting of 548,419,832 people shows a strong negative correlation between the proportion of Immigrants from Asia and labor force participation rate among population between the ages 20 and 24 in the United States with a correlation coefficient (R) of -0.703 and weighted average of 73.6%. Similarly, the statistical analysis conducted on geographies consisting of 227,133,823 people shows a weak positive correlation between the proportion of Immigrants from Australia and labor force participation rate among population between the ages 20 and 24 in the United States with a correlation coefficient (R) of 0.257 and weighted average of 74.6%, a difference of 1.3%.
Immigrants from Asia vs Immigrants from Australia In Labor Force | Age 20-24

In Labor Force | Age 20-24 Correlation Summary

MeasurementImmigrants from AsiaImmigrants from Australia
Minimum50.0%31.2%
Maximum78.9%100.0%
Range28.9%68.8%
Mean70.8%78.5%
Median72.0%75.4%
Interquartile 25% (IQ1)68.9%72.2%
Interquartile 75% (IQ3)74.4%92.3%
Interquartile Range (IQR)5.5%20.1%
Standard Deviation (Sample)5.5%15.4%
Standard Deviation (Population)5.5%15.3%

Similar Demographics by In Labor Force | Age 20-24

Demographics Similar to Immigrants from Asia by In Labor Force | Age 20-24

In terms of in labor force | age 20-24, the demographic groups most similar to Immigrants from Asia are Immigrants from Haiti (73.6%, a difference of 0.010%), Burmese (73.6%, a difference of 0.020%), Haitian (73.6%, a difference of 0.030%), Immigrants from Western Asia (73.5%, a difference of 0.070%), and Asian (73.7%, a difference of 0.080%).
DemographicsRating | RankIn Labor Force | Age 20-24
Spanish American Indians
0.8
/100
|
#256
Tragic
73.7%
Paraguayans
0.8
/100
|
#257
Tragic
73.7%
Egyptians
0.7
/100
|
#258
Tragic
73.7%
Dutch West Indians
0.7
/100
|
#259
Tragic
73.7%
Immigrants | Turkey
0.7
/100
|
#260
Tragic
73.7%
Houma
0.6
/100
|
#261
Tragic
73.7%
Asians
0.6
/100
|
#262
Tragic
73.7%
Immigrants | Asia
0.5
/100
|
#263
Tragic
73.6%
Immigrants | Haiti
0.5
/100
|
#264
Tragic
73.6%
Burmese
0.5
/100
|
#265
Tragic
73.6%
Haitians
0.5
/100
|
#266
Tragic
73.6%
Immigrants | Western Asia
0.4
/100
|
#267
Tragic
73.5%
South Americans
0.4
/100
|
#268
Tragic
73.5%
Colombians
0.3
/100
|
#269
Tragic
73.5%
Immigrants | Russia
0.3
/100
|
#270
Tragic
73.5%

Demographics Similar to Immigrants from Australia by In Labor Force | Age 20-24

In terms of in labor force | age 20-24, the demographic groups most similar to Immigrants from Australia are Uruguayan (74.6%, a difference of 0.010%), Immigrants from Uruguay (74.6%, a difference of 0.030%), Arab (74.6%, a difference of 0.030%), Albanian (74.6%, a difference of 0.040%), and Creek (74.5%, a difference of 0.040%).
DemographicsRating | RankIn Labor Force | Age 20-24
Immigrants | Italy
17.6
/100
|
#204
Poor
74.6%
Inupiat
17.6
/100
|
#205
Poor
74.6%
Sioux
17.5
/100
|
#206
Poor
74.6%
Albanians
16.2
/100
|
#207
Poor
74.6%
Immigrants | Uruguay
15.8
/100
|
#208
Poor
74.6%
Arabs
15.8
/100
|
#209
Poor
74.6%
Uruguayans
15.1
/100
|
#210
Poor
74.6%
Immigrants | Australia
14.7
/100
|
#211
Poor
74.6%
Creek
13.3
/100
|
#212
Poor
74.5%
Peruvians
13.3
/100
|
#213
Poor
74.5%
Immigrants | Southern Europe
13.2
/100
|
#214
Poor
74.5%
Immigrants | Ghana
12.7
/100
|
#215
Poor
74.5%
Immigrants | Kuwait
12.7
/100
|
#216
Poor
74.5%
Chileans
12.5
/100
|
#217
Poor
74.5%
Immigrants | Peru
10.6
/100
|
#218
Poor
74.5%