Danish vs Immigrants from Venezuela In Labor Force | Age 20-24
COMPARE
Danish
Immigrants from Venezuela
In Labor Force | Age 20-24
In Labor Force | Age 20-24 Comparison
Danes
Immigrants from Venezuela
79.0%
IN LABOR FORCE | AGE 20-24
100.0/ 100
METRIC RATING
6th/ 347
METRIC RANK
73.2%
IN LABOR FORCE | AGE 20-24
0.1/ 100
METRIC RATING
281st/ 347
METRIC RANK
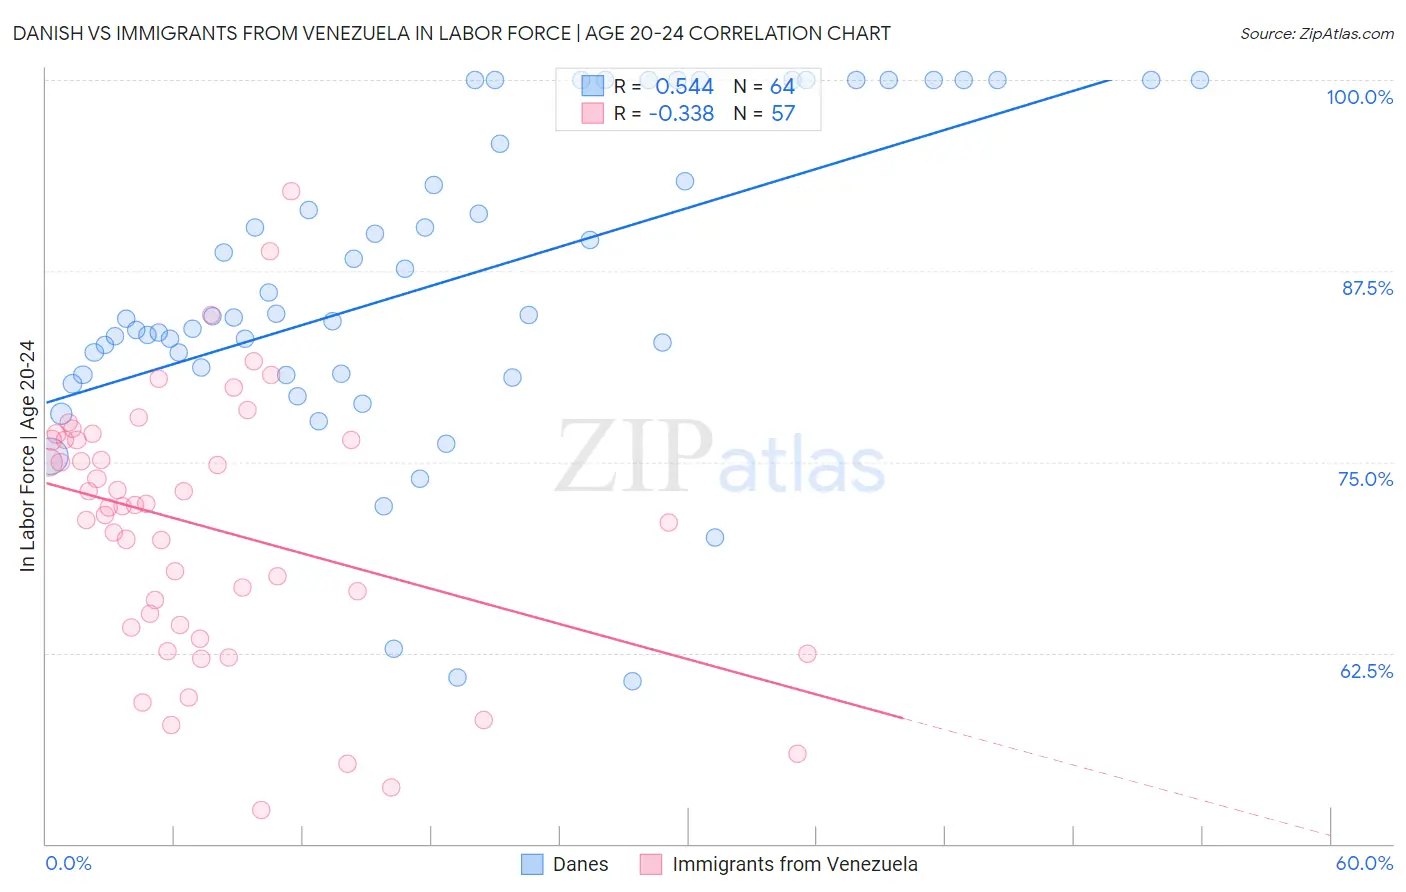
Danish vs Immigrants from Venezuela In Labor Force | Age 20-24 Correlation Chart
The statistical analysis conducted on geographies consisting of 473,606,493 people shows a substantial positive correlation between the proportion of Danes and labor force participation rate among population between the ages 20 and 24 in the United States with a correlation coefficient (R) of 0.544 and weighted average of 79.0%. Similarly, the statistical analysis conducted on geographies consisting of 287,836,016 people shows a mild negative correlation between the proportion of Immigrants from Venezuela and labor force participation rate among population between the ages 20 and 24 in the United States with a correlation coefficient (R) of -0.338 and weighted average of 73.2%, a difference of 7.9%.
In Labor Force | Age 20-24 Correlation Summary
| Measurement | Danish | Immigrants from Venezuela |
| Minimum | 60.6% | 52.2% |
| Maximum | 100.0% | 92.7% |
| Range | 39.4% | 40.5% |
| Mean | 86.7% | 70.7% |
| Median | 84.5% | 72.1% |
| Interquartile 25% (IQ1) | 80.8% | 64.2% |
| Interquartile 75% (IQ3) | 97.9% | 76.5% |
| Interquartile Range (IQR) | 17.1% | 12.2% |
| Standard Deviation (Sample) | 10.2% | 8.6% |
| Standard Deviation (Population) | 10.1% | 8.5% |
Similar Demographics by In Labor Force | Age 20-24
Demographics Similar to Danes by In Labor Force | Age 20-24
In terms of in labor force | age 20-24, the demographic groups most similar to Danes are Aleut (79.0%, a difference of 0.010%), Luxembourger (79.0%, a difference of 0.040%), Alaskan Athabascan (79.1%, a difference of 0.15%), Immigrants from Cabo Verde (78.9%, a difference of 0.15%), and Swedish (78.8%, a difference of 0.21%).
| Demographics | Rating | Rank | In Labor Force | Age 20-24 |
| Norwegians | 100.0 /100 | #1 | Exceptional 80.1% |
| Immigrants | Somalia | 100.0 /100 | #2 | Exceptional 79.5% |
| Somalis | 100.0 /100 | #3 | Exceptional 79.3% |
| Alaskan Athabascans | 100.0 /100 | #4 | Exceptional 79.1% |
| Aleuts | 100.0 /100 | #5 | Exceptional 79.0% |
| Danes | 100.0 /100 | #6 | Exceptional 79.0% |
| Luxembourgers | 100.0 /100 | #7 | Exceptional 79.0% |
| Immigrants | Cabo Verde | 100.0 /100 | #8 | Exceptional 78.9% |
| Swedes | 100.0 /100 | #9 | Exceptional 78.8% |
| Slovenes | 100.0 /100 | #10 | Exceptional 78.7% |
| Finns | 100.0 /100 | #11 | Exceptional 78.7% |
| Germans | 100.0 /100 | #12 | Exceptional 78.6% |
| Scandinavians | 100.0 /100 | #13 | Exceptional 78.5% |
| Czechs | 100.0 /100 | #14 | Exceptional 78.5% |
| Sudanese | 100.0 /100 | #15 | Exceptional 78.4% |
Demographics Similar to Immigrants from Venezuela by In Labor Force | Age 20-24
In terms of in labor force | age 20-24, the demographic groups most similar to Immigrants from Venezuela are Immigrants from Spain (73.2%, a difference of 0.010%), Immigrants from Bahamas (73.2%, a difference of 0.010%), Bahamian (73.3%, a difference of 0.030%), Kiowa (73.2%, a difference of 0.040%), and Nicaraguan (73.2%, a difference of 0.090%).
| Demographics | Rating | Rank | In Labor Force | Age 20-24 |
| Immigrants | Colombia | 0.2 /100 | #274 | Tragic 73.4% |
| Immigrants | South America | 0.2 /100 | #275 | Tragic 73.3% |
| Mongolians | 0.2 /100 | #276 | Tragic 73.3% |
| Immigrants | Malaysia | 0.2 /100 | #277 | Tragic 73.3% |
| Cypriots | 0.2 /100 | #278 | Tragic 73.3% |
| Venezuelans | 0.2 /100 | #279 | Tragic 73.3% |
| Bahamians | 0.1 /100 | #280 | Tragic 73.3% |
| Immigrants | Venezuela | 0.1 /100 | #281 | Tragic 73.2% |
| Immigrants | Spain | 0.1 /100 | #282 | Tragic 73.2% |
| Immigrants | Bahamas | 0.1 /100 | #283 | Tragic 73.2% |
| Kiowa | 0.1 /100 | #284 | Tragic 73.2% |
| Nicaraguans | 0.1 /100 | #285 | Tragic 73.2% |
| Immigrants | Lebanon | 0.1 /100 | #286 | Tragic 73.1% |
| Immigrants | Korea | 0.1 /100 | #287 | Tragic 73.1% |
| Argentineans | 0.1 /100 | #288 | Tragic 73.1% |