Crow vs German Russian In Labor Force | Age 20-24
COMPARE
Crow
German Russian
In Labor Force | Age 20-24
In Labor Force | Age 20-24 Comparison
Crow
German Russians
76.9%
IN LABOR FORCE | AGE 20-24
99.9/ 100
METRIC RATING
65th/ 347
METRIC RANK
77.5%
IN LABOR FORCE | AGE 20-24
100.0/ 100
METRIC RATING
34th/ 347
METRIC RANK
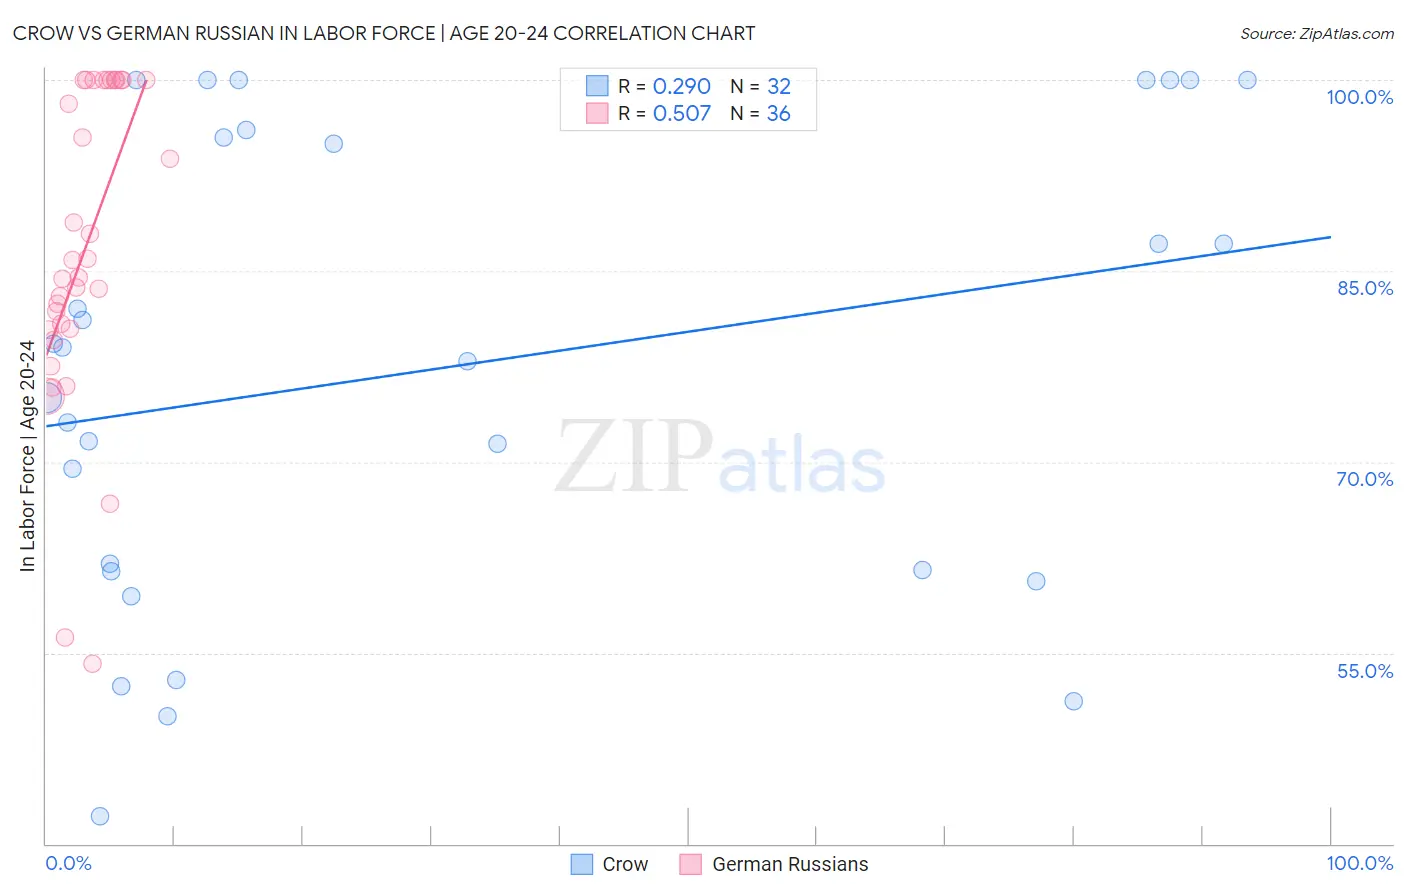
Crow vs German Russian In Labor Force | Age 20-24 Correlation Chart
The statistical analysis conducted on geographies consisting of 59,196,600 people shows a weak positive correlation between the proportion of Crow and labor force participation rate among population between the ages 20 and 24 in the United States with a correlation coefficient (R) of 0.290 and weighted average of 76.9%. Similarly, the statistical analysis conducted on geographies consisting of 96,452,832 people shows a substantial positive correlation between the proportion of German Russians and labor force participation rate among population between the ages 20 and 24 in the United States with a correlation coefficient (R) of 0.507 and weighted average of 77.5%, a difference of 0.83%.
In Labor Force | Age 20-24 Correlation Summary
| Measurement | Crow | German Russian |
| Minimum | 42.2% | 54.1% |
| Maximum | 100.0% | 100.0% |
| Range | 57.8% | 45.9% |
| Mean | 77.3% | 86.7% |
| Median | 78.5% | 85.2% |
| Interquartile 25% (IQ1) | 61.5% | 80.4% |
| Interquartile 75% (IQ3) | 95.8% | 100.0% |
| Interquartile Range (IQR) | 34.3% | 19.6% |
| Standard Deviation (Sample) | 18.1% | 12.3% |
| Standard Deviation (Population) | 17.9% | 12.1% |
Similar Demographics by In Labor Force | Age 20-24
Demographics Similar to Crow by In Labor Force | Age 20-24
In terms of in labor force | age 20-24, the demographic groups most similar to Crow are Icelander (76.9%, a difference of 0.020%), Slavic (76.9%, a difference of 0.020%), White/Caucasian (76.9%, a difference of 0.050%), French American Indian (76.8%, a difference of 0.060%), and Immigrants from Sudan (76.8%, a difference of 0.080%).
| Demographics | Rating | Rank | In Labor Force | Age 20-24 |
| Hawaiians | 99.9 /100 | #58 | Exceptional 77.0% |
| Scotch-Irish | 99.9 /100 | #59 | Exceptional 77.0% |
| Kenyans | 99.9 /100 | #60 | Exceptional 77.0% |
| Immigrants | Eritrea | 99.9 /100 | #61 | Exceptional 77.0% |
| Immigrants | Kenya | 99.9 /100 | #62 | Exceptional 77.0% |
| Lithuanians | 99.9 /100 | #63 | Exceptional 77.0% |
| Whites/Caucasians | 99.9 /100 | #64 | Exceptional 76.9% |
| Crow | 99.9 /100 | #65 | Exceptional 76.9% |
| Icelanders | 99.9 /100 | #66 | Exceptional 76.9% |
| Slavs | 99.9 /100 | #67 | Exceptional 76.9% |
| French American Indians | 99.8 /100 | #68 | Exceptional 76.8% |
| Immigrants | Sudan | 99.8 /100 | #69 | Exceptional 76.8% |
| Ottawa | 99.8 /100 | #70 | Exceptional 76.8% |
| Northern Europeans | 99.8 /100 | #71 | Exceptional 76.8% |
| Guamanians/Chamorros | 99.8 /100 | #72 | Exceptional 76.7% |
Demographics Similar to German Russians by In Labor Force | Age 20-24
In terms of in labor force | age 20-24, the demographic groups most similar to German Russians are Immigrants from Ethiopia (77.5%, a difference of 0.010%), Immigrants from Eastern Africa (77.5%, a difference of 0.010%), Welsh (77.5%, a difference of 0.030%), English (77.6%, a difference of 0.050%), and Czechoslovakian (77.5%, a difference of 0.050%).
| Demographics | Rating | Rank | In Labor Force | Age 20-24 |
| Immigrants | Micronesia | 100.0 /100 | #27 | Exceptional 77.8% |
| Belgians | 100.0 /100 | #28 | Exceptional 77.8% |
| Slovaks | 100.0 /100 | #29 | Exceptional 77.7% |
| Swiss | 100.0 /100 | #30 | Exceptional 77.7% |
| Poles | 100.0 /100 | #31 | Exceptional 77.6% |
| English | 100.0 /100 | #32 | Exceptional 77.6% |
| Immigrants | Ethiopia | 100.0 /100 | #33 | Exceptional 77.5% |
| German Russians | 100.0 /100 | #34 | Exceptional 77.5% |
| Immigrants | Eastern Africa | 100.0 /100 | #35 | Exceptional 77.5% |
| Welsh | 100.0 /100 | #36 | Exceptional 77.5% |
| Czechoslovakians | 100.0 /100 | #37 | Exceptional 77.5% |
| Marshallese | 100.0 /100 | #38 | Exceptional 77.4% |
| Irish | 100.0 /100 | #39 | Exceptional 77.4% |
| Scottish | 100.0 /100 | #40 | Exceptional 77.4% |
| Immigrants | Congo | 100.0 /100 | #41 | Exceptional 77.4% |