Crow vs French In Labor Force | Age 20-24
COMPARE
Crow
French
In Labor Force | Age 20-24
In Labor Force | Age 20-24 Comparison
Crow
French
76.9%
IN LABOR FORCE | AGE 20-24
99.9/ 100
METRIC RATING
65th/ 347
METRIC RANK
77.4%
IN LABOR FORCE | AGE 20-24
100.0/ 100
METRIC RATING
42nd/ 347
METRIC RANK
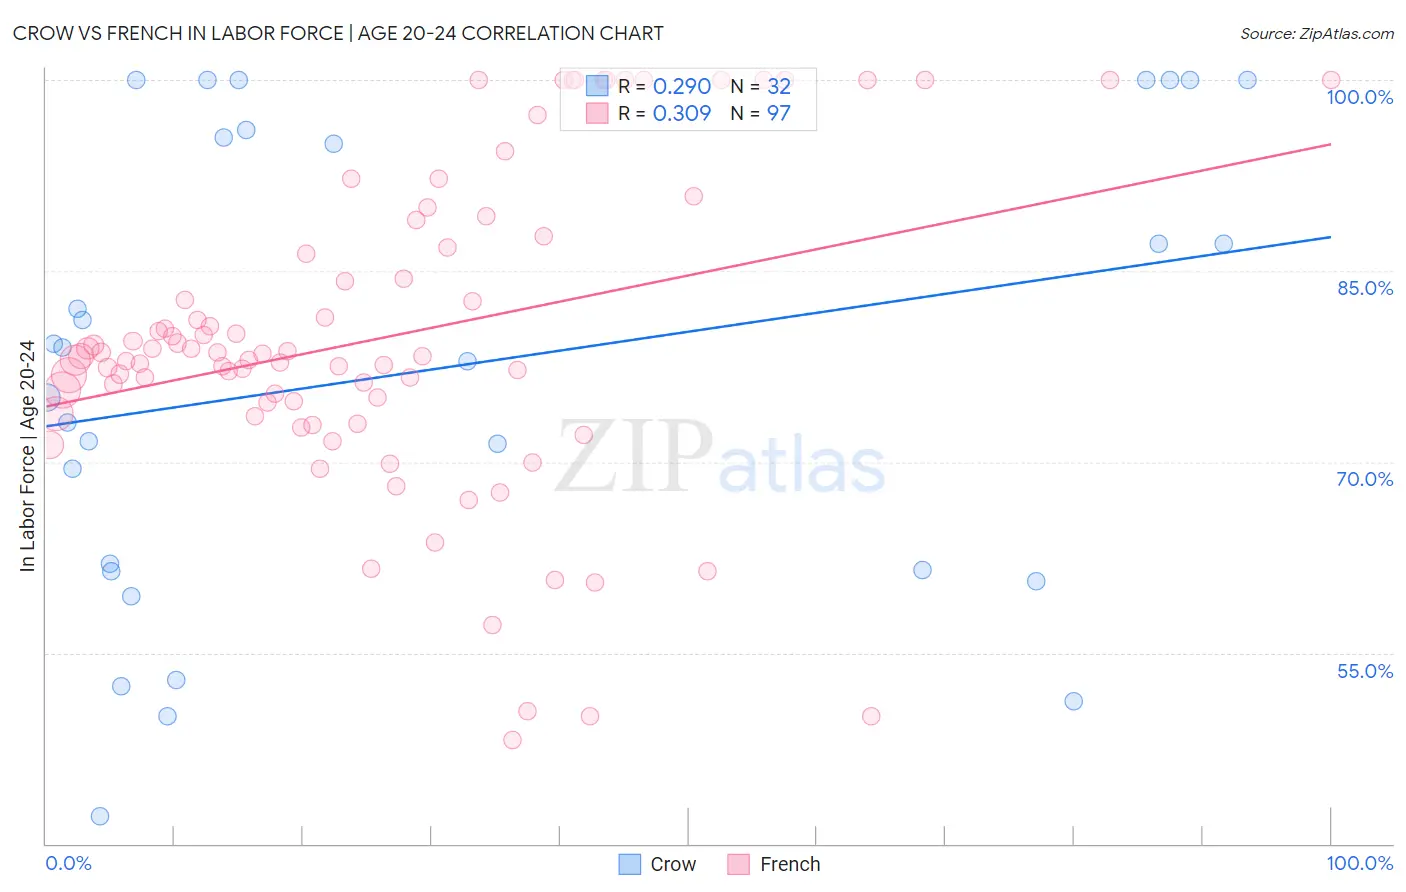
Crow vs French In Labor Force | Age 20-24 Correlation Chart
The statistical analysis conducted on geographies consisting of 59,196,600 people shows a weak positive correlation between the proportion of Crow and labor force participation rate among population between the ages 20 and 24 in the United States with a correlation coefficient (R) of 0.290 and weighted average of 76.9%. Similarly, the statistical analysis conducted on geographies consisting of 570,874,940 people shows a mild positive correlation between the proportion of French and labor force participation rate among population between the ages 20 and 24 in the United States with a correlation coefficient (R) of 0.309 and weighted average of 77.4%, a difference of 0.64%.
In Labor Force | Age 20-24 Correlation Summary
| Measurement | Crow | French |
| Minimum | 42.2% | 48.2% |
| Maximum | 100.0% | 100.0% |
| Range | 57.8% | 51.8% |
| Mean | 77.3% | 79.8% |
| Median | 78.5% | 78.3% |
| Interquartile 25% (IQ1) | 61.5% | 74.2% |
| Interquartile 75% (IQ3) | 95.8% | 87.3% |
| Interquartile Range (IQR) | 34.3% | 13.0% |
| Standard Deviation (Sample) | 18.1% | 12.4% |
| Standard Deviation (Population) | 17.9% | 12.4% |
Similar Demographics by In Labor Force | Age 20-24
Demographics Similar to Crow by In Labor Force | Age 20-24
In terms of in labor force | age 20-24, the demographic groups most similar to Crow are Icelander (76.9%, a difference of 0.020%), Slavic (76.9%, a difference of 0.020%), White/Caucasian (76.9%, a difference of 0.050%), French American Indian (76.8%, a difference of 0.060%), and Immigrants from Sudan (76.8%, a difference of 0.080%).
| Demographics | Rating | Rank | In Labor Force | Age 20-24 |
| Hawaiians | 99.9 /100 | #58 | Exceptional 77.0% |
| Scotch-Irish | 99.9 /100 | #59 | Exceptional 77.0% |
| Kenyans | 99.9 /100 | #60 | Exceptional 77.0% |
| Immigrants | Eritrea | 99.9 /100 | #61 | Exceptional 77.0% |
| Immigrants | Kenya | 99.9 /100 | #62 | Exceptional 77.0% |
| Lithuanians | 99.9 /100 | #63 | Exceptional 77.0% |
| Whites/Caucasians | 99.9 /100 | #64 | Exceptional 76.9% |
| Crow | 99.9 /100 | #65 | Exceptional 76.9% |
| Icelanders | 99.9 /100 | #66 | Exceptional 76.9% |
| Slavs | 99.9 /100 | #67 | Exceptional 76.9% |
| French American Indians | 99.8 /100 | #68 | Exceptional 76.8% |
| Immigrants | Sudan | 99.8 /100 | #69 | Exceptional 76.8% |
| Ottawa | 99.8 /100 | #70 | Exceptional 76.8% |
| Northern Europeans | 99.8 /100 | #71 | Exceptional 76.8% |
| Guamanians/Chamorros | 99.8 /100 | #72 | Exceptional 76.7% |
Demographics Similar to French by In Labor Force | Age 20-24
In terms of in labor force | age 20-24, the demographic groups most similar to French are Immigrants from Laos (77.4%, a difference of 0.0%), Immigrants from Congo (77.4%, a difference of 0.010%), Fijian (77.4%, a difference of 0.020%), Scottish (77.4%, a difference of 0.030%), and Native Hawaiian (77.4%, a difference of 0.030%).
| Demographics | Rating | Rank | In Labor Force | Age 20-24 |
| Immigrants | Eastern Africa | 100.0 /100 | #35 | Exceptional 77.5% |
| Welsh | 100.0 /100 | #36 | Exceptional 77.5% |
| Czechoslovakians | 100.0 /100 | #37 | Exceptional 77.5% |
| Marshallese | 100.0 /100 | #38 | Exceptional 77.4% |
| Irish | 100.0 /100 | #39 | Exceptional 77.4% |
| Scottish | 100.0 /100 | #40 | Exceptional 77.4% |
| Immigrants | Congo | 100.0 /100 | #41 | Exceptional 77.4% |
| French | 100.0 /100 | #42 | Exceptional 77.4% |
| Immigrants | Laos | 100.0 /100 | #43 | Exceptional 77.4% |
| Fijians | 100.0 /100 | #44 | Exceptional 77.4% |
| Native Hawaiians | 100.0 /100 | #45 | Exceptional 77.4% |
| Samoans | 100.0 /100 | #46 | Exceptional 77.4% |
| Ethiopians | 100.0 /100 | #47 | Exceptional 77.3% |
| Serbians | 100.0 /100 | #48 | Exceptional 77.3% |
| Chinese | 100.0 /100 | #49 | Exceptional 77.3% |