Creek vs Immigrants from Western Africa In Labor Force | Age 30-34
COMPARE
Creek
Immigrants from Western Africa
In Labor Force | Age 30-34
In Labor Force | Age 30-34 Comparison
Creek
Immigrants from Western Africa
80.4%
IN LABOR FORCE | AGE 30-34
0.0/ 100
METRIC RATING
329th/ 347
METRIC RANK
85.0%
IN LABOR FORCE | AGE 30-34
90.2/ 100
METRIC RATING
129th/ 347
METRIC RANK
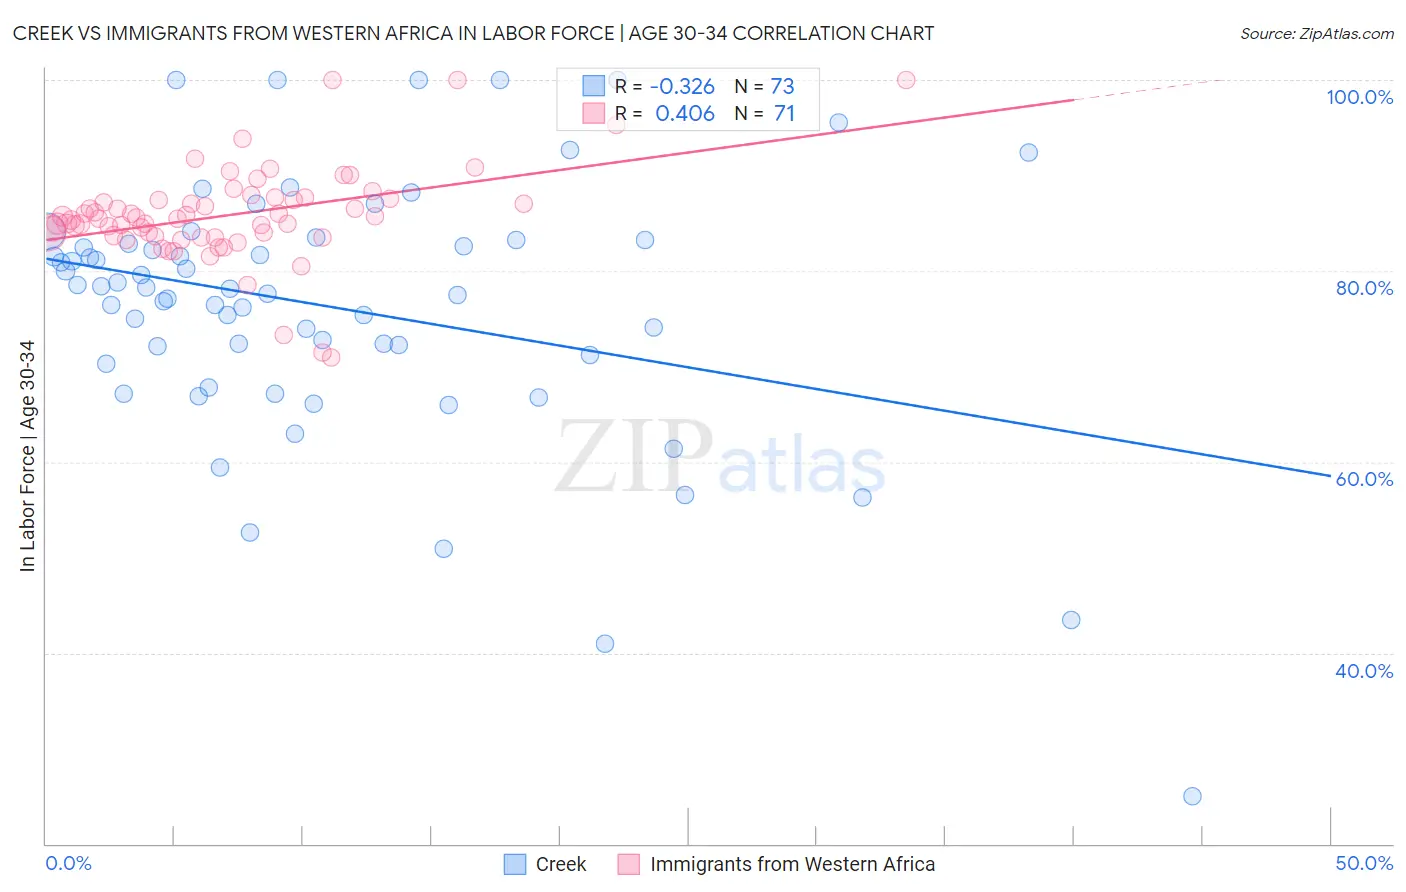
Creek vs Immigrants from Western Africa In Labor Force | Age 30-34 Correlation Chart
The statistical analysis conducted on geographies consisting of 178,425,767 people shows a mild negative correlation between the proportion of Creek and labor force participation rate among population between the ages 30 and 34 in the United States with a correlation coefficient (R) of -0.326 and weighted average of 80.4%. Similarly, the statistical analysis conducted on geographies consisting of 357,656,642 people shows a moderate positive correlation between the proportion of Immigrants from Western Africa and labor force participation rate among population between the ages 30 and 34 in the United States with a correlation coefficient (R) of 0.406 and weighted average of 85.0%, a difference of 5.8%.
In Labor Force | Age 30-34 Correlation Summary
| Measurement | Creek | Immigrants from Western Africa |
| Minimum | 25.0% | 70.9% |
| Maximum | 100.0% | 100.0% |
| Range | 75.0% | 29.1% |
| Mean | 76.2% | 85.9% |
| Median | 78.2% | 85.4% |
| Interquartile 25% (IQ1) | 70.7% | 83.7% |
| Interquartile 75% (IQ3) | 83.1% | 87.6% |
| Interquartile Range (IQR) | 12.4% | 3.9% |
| Standard Deviation (Sample) | 13.7% | 5.0% |
| Standard Deviation (Population) | 13.6% | 5.0% |
Similar Demographics by In Labor Force | Age 30-34
Demographics Similar to Creek by In Labor Force | Age 30-34
In terms of in labor force | age 30-34, the demographic groups most similar to Creek are Sioux (80.4%, a difference of 0.010%), Pueblo (80.0%, a difference of 0.40%), Colville (80.7%, a difference of 0.41%), Houma (79.9%, a difference of 0.58%), and Seminole (80.8%, a difference of 0.60%).
| Demographics | Rating | Rank | In Labor Force | Age 30-34 |
| Puerto Ricans | 0.0 /100 | #322 | Tragic 81.2% |
| Paiute | 0.0 /100 | #323 | Tragic 81.2% |
| Cheyenne | 0.0 /100 | #324 | Tragic 81.1% |
| Dutch West Indians | 0.0 /100 | #325 | Tragic 81.0% |
| Seminole | 0.0 /100 | #326 | Tragic 80.8% |
| Colville | 0.0 /100 | #327 | Tragic 80.7% |
| Sioux | 0.0 /100 | #328 | Tragic 80.4% |
| Creek | 0.0 /100 | #329 | Tragic 80.4% |
| Pueblo | 0.0 /100 | #330 | Tragic 80.0% |
| Houma | 0.0 /100 | #331 | Tragic 79.9% |
| Kiowa | 0.0 /100 | #332 | Tragic 79.8% |
| Inupiat | 0.0 /100 | #333 | Tragic 79.7% |
| Hopi | 0.0 /100 | #334 | Tragic 79.3% |
| Marshallese | 0.0 /100 | #335 | Tragic 79.2% |
| Natives/Alaskans | 0.0 /100 | #336 | Tragic 79.2% |
Demographics Similar to Immigrants from Western Africa by In Labor Force | Age 30-34
In terms of in labor force | age 30-34, the demographic groups most similar to Immigrants from Western Africa are Immigrants from Spain (85.0%, a difference of 0.0%), Slavic (85.0%, a difference of 0.010%), Immigrants from Argentina (85.0%, a difference of 0.010%), Chinese (85.0%, a difference of 0.010%), and Immigrants from Israel (85.0%, a difference of 0.010%).
| Demographics | Rating | Rank | In Labor Force | Age 30-34 |
| Immigrants | Kuwait | 92.6 /100 | #122 | Exceptional 85.1% |
| Armenians | 92.2 /100 | #123 | Exceptional 85.0% |
| Australians | 92.0 /100 | #124 | Exceptional 85.0% |
| Immigrants | Jordan | 91.5 /100 | #125 | Exceptional 85.0% |
| Austrians | 90.9 /100 | #126 | Exceptional 85.0% |
| Slavs | 90.7 /100 | #127 | Exceptional 85.0% |
| Immigrants | Argentina | 90.6 /100 | #128 | Exceptional 85.0% |
| Immigrants | Western Africa | 90.2 /100 | #129 | Exceptional 85.0% |
| Immigrants | Spain | 90.0 /100 | #130 | Exceptional 85.0% |
| Chinese | 89.6 /100 | #131 | Excellent 85.0% |
| Immigrants | Israel | 89.5 /100 | #132 | Excellent 85.0% |
| New Zealanders | 89.5 /100 | #133 | Excellent 85.0% |
| Immigrants | Chile | 89.2 /100 | #134 | Excellent 85.0% |
| Immigrants | Asia | 88.9 /100 | #135 | Excellent 85.0% |
| Jordanians | 88.6 /100 | #136 | Excellent 85.0% |