Irish vs Immigrants from Western Africa In Labor Force | Age 30-34
COMPARE
Irish
Immigrants from Western Africa
In Labor Force | Age 30-34
In Labor Force | Age 30-34 Comparison
Irish
Immigrants from Western Africa
84.7%
IN LABOR FORCE | AGE 30-34
52.0/ 100
METRIC RATING
171st/ 347
METRIC RANK
85.0%
IN LABOR FORCE | AGE 30-34
90.2/ 100
METRIC RATING
129th/ 347
METRIC RANK
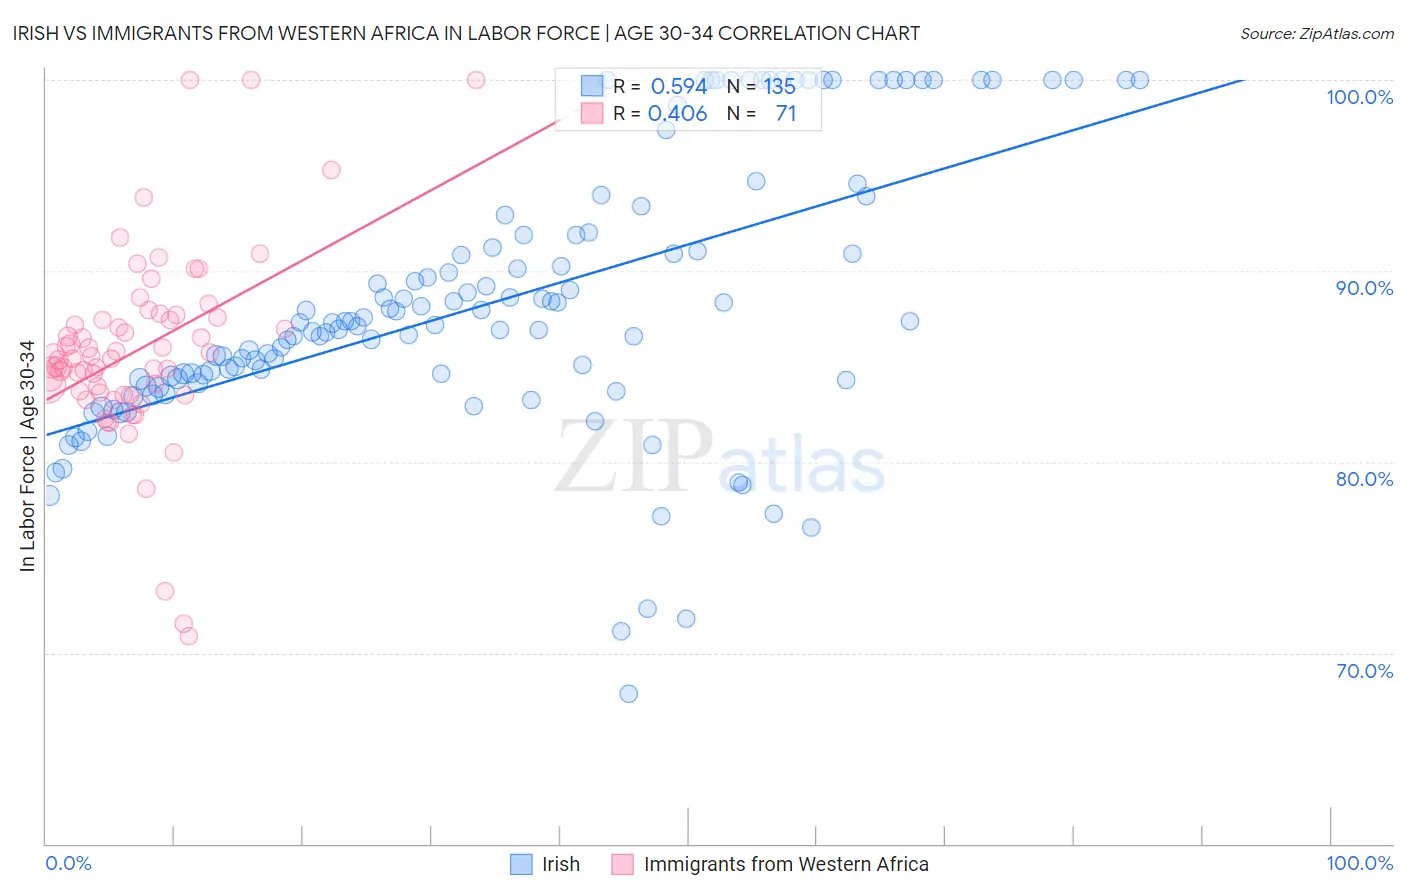
Irish vs Immigrants from Western Africa In Labor Force | Age 30-34 Correlation Chart
The statistical analysis conducted on geographies consisting of 578,567,964 people shows a substantial positive correlation between the proportion of Irish and labor force participation rate among population between the ages 30 and 34 in the United States with a correlation coefficient (R) of 0.594 and weighted average of 84.7%. Similarly, the statistical analysis conducted on geographies consisting of 357,656,642 people shows a moderate positive correlation between the proportion of Immigrants from Western Africa and labor force participation rate among population between the ages 30 and 34 in the United States with a correlation coefficient (R) of 0.406 and weighted average of 85.0%, a difference of 0.38%.
In Labor Force | Age 30-34 Correlation Summary
| Measurement | Irish | Immigrants from Western Africa |
| Minimum | 67.8% | 70.9% |
| Maximum | 100.0% | 100.0% |
| Range | 32.2% | 29.1% |
| Mean | 88.3% | 85.9% |
| Median | 87.3% | 85.4% |
| Interquartile 25% (IQ1) | 84.3% | 83.7% |
| Interquartile 75% (IQ3) | 91.9% | 87.6% |
| Interquartile Range (IQR) | 7.6% | 3.9% |
| Standard Deviation (Sample) | 7.1% | 5.0% |
| Standard Deviation (Population) | 7.1% | 5.0% |
Similar Demographics by In Labor Force | Age 30-34
Demographics Similar to Irish by In Labor Force | Age 30-34
In terms of in labor force | age 30-34, the demographic groups most similar to Irish are Immigrants from Peru (84.7%, a difference of 0.0%), South American Indian (84.7%, a difference of 0.0%), Immigrants from Burma/Myanmar (84.7%, a difference of 0.0%), Immigrants from England (84.7%, a difference of 0.0%), and Israeli (84.7%, a difference of 0.010%).
| Demographics | Rating | Rank | In Labor Force | Age 30-34 |
| Icelanders | 56.8 /100 | #164 | Average 84.7% |
| Immigrants | Western Europe | 56.7 /100 | #165 | Average 84.7% |
| Afghans | 55.2 /100 | #166 | Average 84.7% |
| Immigrants | South Eastern Asia | 54.2 /100 | #167 | Average 84.7% |
| Immigrants | Peru | 52.4 /100 | #168 | Average 84.7% |
| South American Indians | 52.1 /100 | #169 | Average 84.7% |
| Immigrants | Burma/Myanmar | 52.0 /100 | #170 | Average 84.7% |
| Irish | 52.0 /100 | #171 | Average 84.7% |
| Immigrants | England | 51.7 /100 | #172 | Average 84.7% |
| Israelis | 51.1 /100 | #173 | Average 84.7% |
| Finns | 50.0 /100 | #174 | Average 84.7% |
| Immigrants | South America | 50.0 /100 | #175 | Average 84.7% |
| Immigrants | Uzbekistan | 49.1 /100 | #176 | Average 84.7% |
| Laotians | 46.9 /100 | #177 | Average 84.7% |
| Okinawans | 44.1 /100 | #178 | Average 84.6% |
Demographics Similar to Immigrants from Western Africa by In Labor Force | Age 30-34
In terms of in labor force | age 30-34, the demographic groups most similar to Immigrants from Western Africa are Immigrants from Spain (85.0%, a difference of 0.0%), Slavic (85.0%, a difference of 0.010%), Immigrants from Argentina (85.0%, a difference of 0.010%), Chinese (85.0%, a difference of 0.010%), and Immigrants from Israel (85.0%, a difference of 0.010%).
| Demographics | Rating | Rank | In Labor Force | Age 30-34 |
| Immigrants | Kuwait | 92.6 /100 | #122 | Exceptional 85.1% |
| Armenians | 92.2 /100 | #123 | Exceptional 85.0% |
| Australians | 92.0 /100 | #124 | Exceptional 85.0% |
| Immigrants | Jordan | 91.5 /100 | #125 | Exceptional 85.0% |
| Austrians | 90.9 /100 | #126 | Exceptional 85.0% |
| Slavs | 90.7 /100 | #127 | Exceptional 85.0% |
| Immigrants | Argentina | 90.6 /100 | #128 | Exceptional 85.0% |
| Immigrants | Western Africa | 90.2 /100 | #129 | Exceptional 85.0% |
| Immigrants | Spain | 90.0 /100 | #130 | Exceptional 85.0% |
| Chinese | 89.6 /100 | #131 | Excellent 85.0% |
| Immigrants | Israel | 89.5 /100 | #132 | Excellent 85.0% |
| New Zealanders | 89.5 /100 | #133 | Excellent 85.0% |
| Immigrants | Chile | 89.2 /100 | #134 | Excellent 85.0% |
| Immigrants | Asia | 88.9 /100 | #135 | Excellent 85.0% |
| Jordanians | 88.6 /100 | #136 | Excellent 85.0% |