Creek vs Immigrants from Sierra Leone In Labor Force | Age 30-34
COMPARE
Creek
Immigrants from Sierra Leone
In Labor Force | Age 30-34
In Labor Force | Age 30-34 Comparison
Creek
Immigrants from Sierra Leone
80.4%
IN LABOR FORCE | AGE 30-34
0.0/ 100
METRIC RATING
329th/ 347
METRIC RANK
86.0%
IN LABOR FORCE | AGE 30-34
100.0/ 100
METRIC RATING
18th/ 347
METRIC RANK
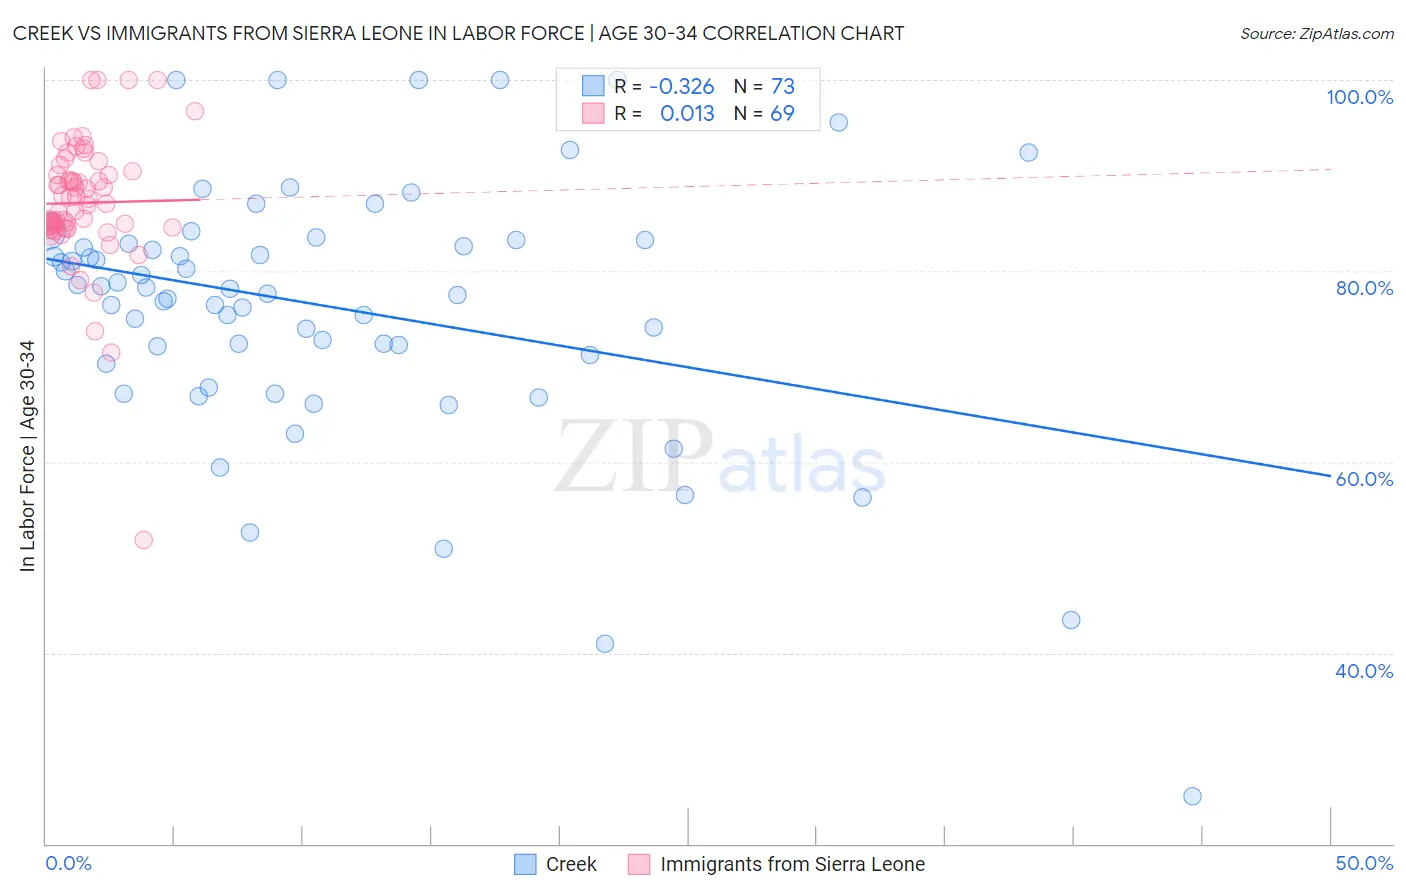
Creek vs Immigrants from Sierra Leone In Labor Force | Age 30-34 Correlation Chart
The statistical analysis conducted on geographies consisting of 178,425,767 people shows a mild negative correlation between the proportion of Creek and labor force participation rate among population between the ages 30 and 34 in the United States with a correlation coefficient (R) of -0.326 and weighted average of 80.4%. Similarly, the statistical analysis conducted on geographies consisting of 101,642,692 people shows no correlation between the proportion of Immigrants from Sierra Leone and labor force participation rate among population between the ages 30 and 34 in the United States with a correlation coefficient (R) of 0.013 and weighted average of 86.0%, a difference of 7.0%.
In Labor Force | Age 30-34 Correlation Summary
| Measurement | Creek | Immigrants from Sierra Leone |
| Minimum | 25.0% | 51.8% |
| Maximum | 100.0% | 100.0% |
| Range | 75.0% | 48.2% |
| Mean | 76.2% | 87.1% |
| Median | 78.2% | 87.1% |
| Interquartile 25% (IQ1) | 70.7% | 84.6% |
| Interquartile 75% (IQ3) | 83.1% | 90.2% |
| Interquartile Range (IQR) | 12.4% | 5.7% |
| Standard Deviation (Sample) | 13.7% | 6.9% |
| Standard Deviation (Population) | 13.6% | 6.9% |
Similar Demographics by In Labor Force | Age 30-34
Demographics Similar to Creek by In Labor Force | Age 30-34
In terms of in labor force | age 30-34, the demographic groups most similar to Creek are Sioux (80.4%, a difference of 0.010%), Pueblo (80.0%, a difference of 0.40%), Colville (80.7%, a difference of 0.41%), Houma (79.9%, a difference of 0.58%), and Seminole (80.8%, a difference of 0.60%).
| Demographics | Rating | Rank | In Labor Force | Age 30-34 |
| Puerto Ricans | 0.0 /100 | #322 | Tragic 81.2% |
| Paiute | 0.0 /100 | #323 | Tragic 81.2% |
| Cheyenne | 0.0 /100 | #324 | Tragic 81.1% |
| Dutch West Indians | 0.0 /100 | #325 | Tragic 81.0% |
| Seminole | 0.0 /100 | #326 | Tragic 80.8% |
| Colville | 0.0 /100 | #327 | Tragic 80.7% |
| Sioux | 0.0 /100 | #328 | Tragic 80.4% |
| Creek | 0.0 /100 | #329 | Tragic 80.4% |
| Pueblo | 0.0 /100 | #330 | Tragic 80.0% |
| Houma | 0.0 /100 | #331 | Tragic 79.9% |
| Kiowa | 0.0 /100 | #332 | Tragic 79.8% |
| Inupiat | 0.0 /100 | #333 | Tragic 79.7% |
| Hopi | 0.0 /100 | #334 | Tragic 79.3% |
| Marshallese | 0.0 /100 | #335 | Tragic 79.2% |
| Natives/Alaskans | 0.0 /100 | #336 | Tragic 79.2% |
Demographics Similar to Immigrants from Sierra Leone by In Labor Force | Age 30-34
In terms of in labor force | age 30-34, the demographic groups most similar to Immigrants from Sierra Leone are Latvian (86.0%, a difference of 0.040%), Immigrants from Cameroon (86.0%, a difference of 0.040%), Sierra Leonean (86.0%, a difference of 0.050%), Bulgarian (86.0%, a difference of 0.050%), and Immigrants from Bulgaria (86.0%, a difference of 0.060%).
| Demographics | Rating | Rank | In Labor Force | Age 30-34 |
| Carpatho Rusyns | 100.0 /100 | #11 | Exceptional 86.2% |
| Bolivians | 100.0 /100 | #12 | Exceptional 86.1% |
| Immigrants | Croatia | 100.0 /100 | #13 | Exceptional 86.1% |
| Immigrants | Cabo Verde | 100.0 /100 | #14 | Exceptional 86.1% |
| Immigrants | Albania | 100.0 /100 | #15 | Exceptional 86.1% |
| Latvians | 100.0 /100 | #16 | Exceptional 86.0% |
| Immigrants | Cameroon | 100.0 /100 | #17 | Exceptional 86.0% |
| Immigrants | Sierra Leone | 100.0 /100 | #18 | Exceptional 86.0% |
| Sierra Leoneans | 100.0 /100 | #19 | Exceptional 86.0% |
| Bulgarians | 100.0 /100 | #20 | Exceptional 86.0% |
| Immigrants | Bulgaria | 100.0 /100 | #21 | Exceptional 86.0% |
| Bermudans | 100.0 /100 | #22 | Exceptional 85.9% |
| Estonians | 100.0 /100 | #23 | Exceptional 85.9% |
| Immigrants | Eritrea | 100.0 /100 | #24 | Exceptional 85.9% |
| Immigrants | North Macedonia | 100.0 /100 | #25 | Exceptional 85.9% |