Immigrants from Syria vs Immigrants from Western Africa In Labor Force | Age 30-34
COMPARE
Immigrants from Syria
Immigrants from Western Africa
In Labor Force | Age 30-34
In Labor Force | Age 30-34 Comparison
Immigrants from Syria
Immigrants from Western Africa
84.5%
IN LABOR FORCE | AGE 30-34
21.9/ 100
METRIC RATING
197th/ 347
METRIC RANK
85.0%
IN LABOR FORCE | AGE 30-34
90.2/ 100
METRIC RATING
129th/ 347
METRIC RANK
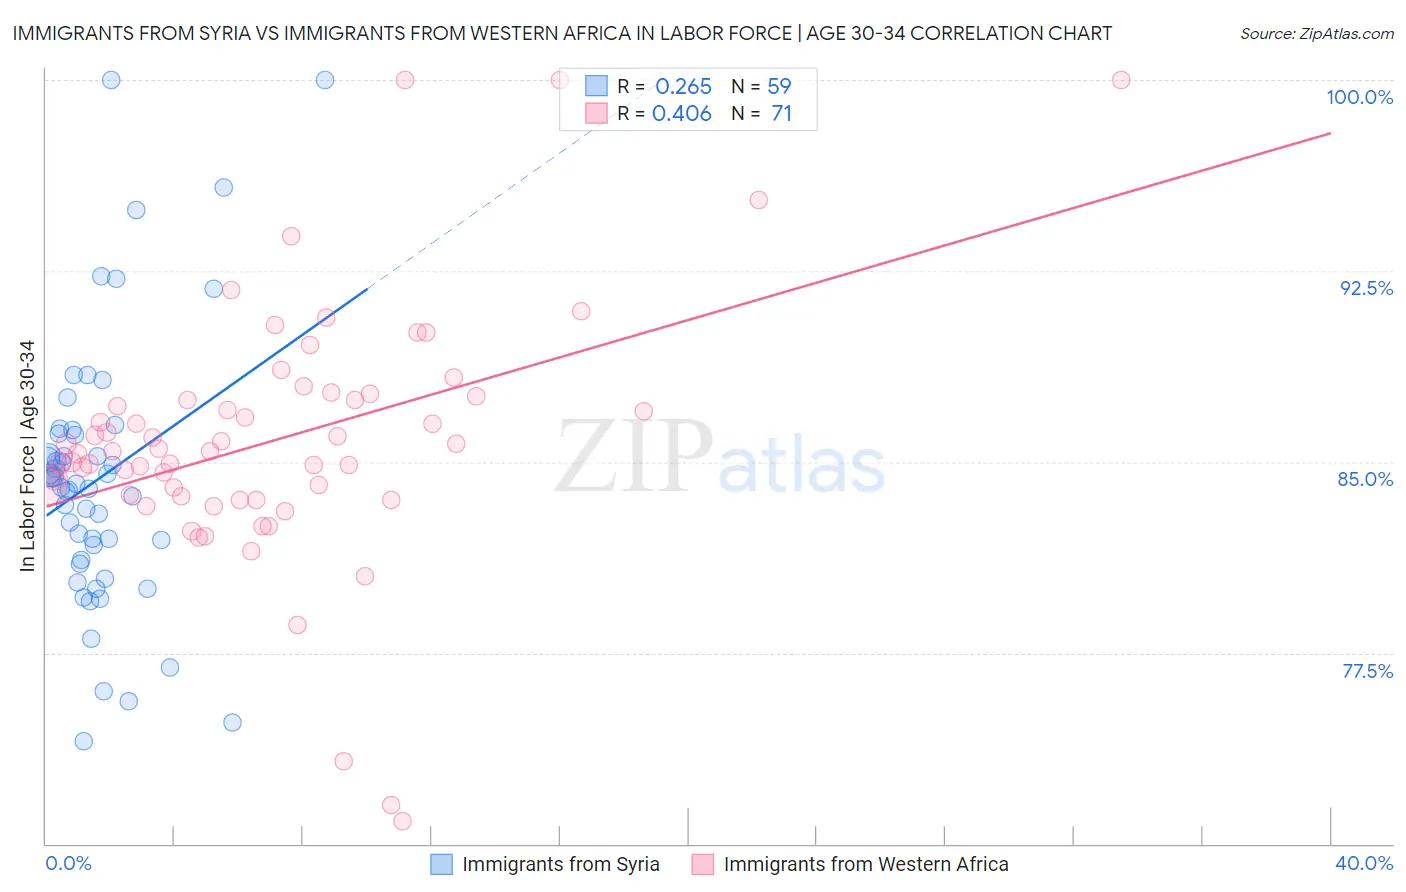
Immigrants from Syria vs Immigrants from Western Africa In Labor Force | Age 30-34 Correlation Chart
The statistical analysis conducted on geographies consisting of 174,094,070 people shows a weak positive correlation between the proportion of Immigrants from Syria and labor force participation rate among population between the ages 30 and 34 in the United States with a correlation coefficient (R) of 0.265 and weighted average of 84.5%. Similarly, the statistical analysis conducted on geographies consisting of 357,656,642 people shows a moderate positive correlation between the proportion of Immigrants from Western Africa and labor force participation rate among population between the ages 30 and 34 in the United States with a correlation coefficient (R) of 0.406 and weighted average of 85.0%, a difference of 0.61%.
In Labor Force | Age 30-34 Correlation Summary
| Measurement | Immigrants from Syria | Immigrants from Western Africa |
| Minimum | 74.0% | 70.9% |
| Maximum | 100.0% | 100.0% |
| Range | 26.0% | 29.1% |
| Mean | 84.3% | 85.9% |
| Median | 84.1% | 85.4% |
| Interquartile 25% (IQ1) | 81.2% | 83.7% |
| Interquartile 75% (IQ3) | 86.1% | 87.6% |
| Interquartile Range (IQR) | 4.9% | 3.9% |
| Standard Deviation (Sample) | 5.3% | 5.0% |
| Standard Deviation (Population) | 5.3% | 5.0% |
Similar Demographics by In Labor Force | Age 30-34
Demographics Similar to Immigrants from Syria by In Labor Force | Age 30-34
In terms of in labor force | age 30-34, the demographic groups most similar to Immigrants from Syria are Korean (84.5%, a difference of 0.010%), British (84.5%, a difference of 0.010%), Immigrants from Costa Rica (84.5%, a difference of 0.020%), Immigrants from Afghanistan (84.5%, a difference of 0.020%), and Dutch (84.5%, a difference of 0.020%).
| Demographics | Rating | Rank | In Labor Force | Age 30-34 |
| Immigrants | Zaire | 25.8 /100 | #190 | Fair 84.5% |
| Hungarians | 24.8 /100 | #191 | Fair 84.5% |
| Scandinavians | 24.7 /100 | #192 | Fair 84.5% |
| Immigrants | Costa Rica | 23.9 /100 | #193 | Fair 84.5% |
| Immigrants | Afghanistan | 23.5 /100 | #194 | Fair 84.5% |
| Koreans | 23.2 /100 | #195 | Fair 84.5% |
| British | 22.9 /100 | #196 | Fair 84.5% |
| Immigrants | Syria | 21.9 /100 | #197 | Fair 84.5% |
| Dutch | 20.2 /100 | #198 | Fair 84.5% |
| Immigrants | Thailand | 19.1 /100 | #199 | Poor 84.5% |
| Sub-Saharan Africans | 19.0 /100 | #200 | Poor 84.5% |
| Trinidadians and Tobagonians | 18.2 /100 | #201 | Poor 84.5% |
| Immigrants | West Indies | 18.1 /100 | #202 | Poor 84.5% |
| Canadians | 15.4 /100 | #203 | Poor 84.4% |
| Ecuadorians | 14.2 /100 | #204 | Poor 84.4% |
Demographics Similar to Immigrants from Western Africa by In Labor Force | Age 30-34
In terms of in labor force | age 30-34, the demographic groups most similar to Immigrants from Western Africa are Immigrants from Spain (85.0%, a difference of 0.0%), Slavic (85.0%, a difference of 0.010%), Immigrants from Argentina (85.0%, a difference of 0.010%), Chinese (85.0%, a difference of 0.010%), and Immigrants from Israel (85.0%, a difference of 0.010%).
| Demographics | Rating | Rank | In Labor Force | Age 30-34 |
| Immigrants | Kuwait | 92.6 /100 | #122 | Exceptional 85.1% |
| Armenians | 92.2 /100 | #123 | Exceptional 85.0% |
| Australians | 92.0 /100 | #124 | Exceptional 85.0% |
| Immigrants | Jordan | 91.5 /100 | #125 | Exceptional 85.0% |
| Austrians | 90.9 /100 | #126 | Exceptional 85.0% |
| Slavs | 90.7 /100 | #127 | Exceptional 85.0% |
| Immigrants | Argentina | 90.6 /100 | #128 | Exceptional 85.0% |
| Immigrants | Western Africa | 90.2 /100 | #129 | Exceptional 85.0% |
| Immigrants | Spain | 90.0 /100 | #130 | Exceptional 85.0% |
| Chinese | 89.6 /100 | #131 | Excellent 85.0% |
| Immigrants | Israel | 89.5 /100 | #132 | Excellent 85.0% |
| New Zealanders | 89.5 /100 | #133 | Excellent 85.0% |
| Immigrants | Chile | 89.2 /100 | #134 | Excellent 85.0% |
| Immigrants | Asia | 88.9 /100 | #135 | Excellent 85.0% |
| Jordanians | 88.6 /100 | #136 | Excellent 85.0% |