Creek vs Okinawan In Labor Force | Age 30-34
COMPARE
Creek
Okinawan
In Labor Force | Age 30-34
In Labor Force | Age 30-34 Comparison
Creek
Okinawans
80.4%
IN LABOR FORCE | AGE 30-34
0.0/ 100
METRIC RATING
329th/ 347
METRIC RANK
84.6%
IN LABOR FORCE | AGE 30-34
44.1/ 100
METRIC RATING
178th/ 347
METRIC RANK
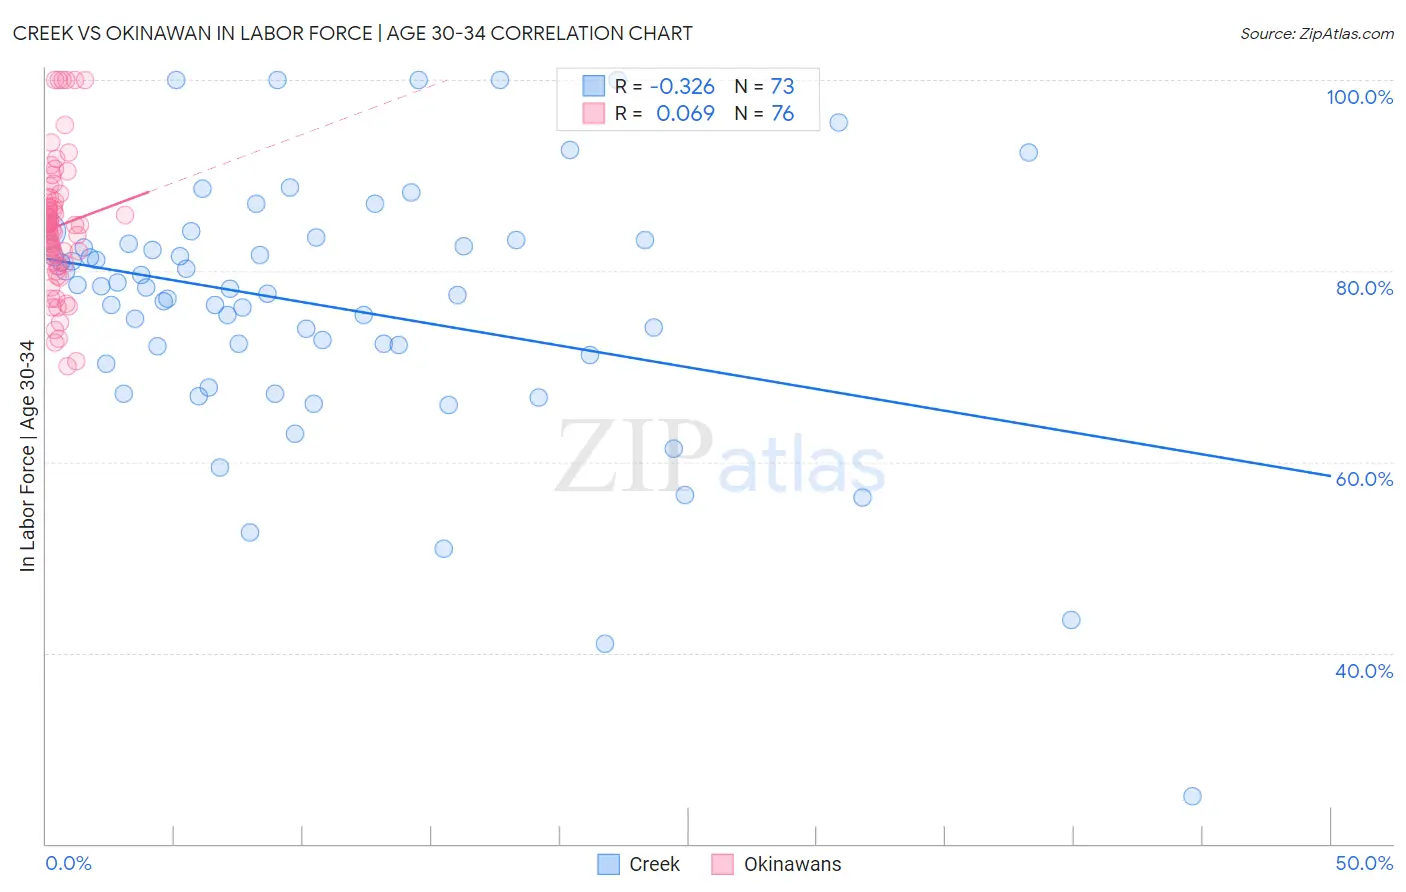
Creek vs Okinawan In Labor Force | Age 30-34 Correlation Chart
The statistical analysis conducted on geographies consisting of 178,425,767 people shows a mild negative correlation between the proportion of Creek and labor force participation rate among population between the ages 30 and 34 in the United States with a correlation coefficient (R) of -0.326 and weighted average of 80.4%. Similarly, the statistical analysis conducted on geographies consisting of 73,721,910 people shows a slight positive correlation between the proportion of Okinawans and labor force participation rate among population between the ages 30 and 34 in the United States with a correlation coefficient (R) of 0.069 and weighted average of 84.6%, a difference of 5.3%.
In Labor Force | Age 30-34 Correlation Summary
| Measurement | Creek | Okinawan |
| Minimum | 25.0% | 70.0% |
| Maximum | 100.0% | 100.0% |
| Range | 75.0% | 30.0% |
| Mean | 76.2% | 84.7% |
| Median | 78.2% | 84.7% |
| Interquartile 25% (IQ1) | 70.7% | 80.9% |
| Interquartile 75% (IQ3) | 83.1% | 87.5% |
| Interquartile Range (IQR) | 12.4% | 6.6% |
| Standard Deviation (Sample) | 13.7% | 6.8% |
| Standard Deviation (Population) | 13.6% | 6.8% |
Similar Demographics by In Labor Force | Age 30-34
Demographics Similar to Creek by In Labor Force | Age 30-34
In terms of in labor force | age 30-34, the demographic groups most similar to Creek are Sioux (80.4%, a difference of 0.010%), Pueblo (80.0%, a difference of 0.40%), Colville (80.7%, a difference of 0.41%), Houma (79.9%, a difference of 0.58%), and Seminole (80.8%, a difference of 0.60%).
| Demographics | Rating | Rank | In Labor Force | Age 30-34 |
| Puerto Ricans | 0.0 /100 | #322 | Tragic 81.2% |
| Paiute | 0.0 /100 | #323 | Tragic 81.2% |
| Cheyenne | 0.0 /100 | #324 | Tragic 81.1% |
| Dutch West Indians | 0.0 /100 | #325 | Tragic 81.0% |
| Seminole | 0.0 /100 | #326 | Tragic 80.8% |
| Colville | 0.0 /100 | #327 | Tragic 80.7% |
| Sioux | 0.0 /100 | #328 | Tragic 80.4% |
| Creek | 0.0 /100 | #329 | Tragic 80.4% |
| Pueblo | 0.0 /100 | #330 | Tragic 80.0% |
| Houma | 0.0 /100 | #331 | Tragic 79.9% |
| Kiowa | 0.0 /100 | #332 | Tragic 79.8% |
| Inupiat | 0.0 /100 | #333 | Tragic 79.7% |
| Hopi | 0.0 /100 | #334 | Tragic 79.3% |
| Marshallese | 0.0 /100 | #335 | Tragic 79.2% |
| Natives/Alaskans | 0.0 /100 | #336 | Tragic 79.2% |
Demographics Similar to Okinawans by In Labor Force | Age 30-34
In terms of in labor force | age 30-34, the demographic groups most similar to Okinawans are Immigrants from Nigeria (84.6%, a difference of 0.010%), Immigrants from Netherlands (84.6%, a difference of 0.010%), Laotian (84.7%, a difference of 0.020%), Moroccan (84.6%, a difference of 0.030%), and Finnish (84.7%, a difference of 0.040%).
| Demographics | Rating | Rank | In Labor Force | Age 30-34 |
| Irish | 52.0 /100 | #171 | Average 84.7% |
| Immigrants | England | 51.7 /100 | #172 | Average 84.7% |
| Israelis | 51.1 /100 | #173 | Average 84.7% |
| Finns | 50.0 /100 | #174 | Average 84.7% |
| Immigrants | South America | 50.0 /100 | #175 | Average 84.7% |
| Immigrants | Uzbekistan | 49.1 /100 | #176 | Average 84.7% |
| Laotians | 46.9 /100 | #177 | Average 84.7% |
| Okinawans | 44.1 /100 | #178 | Average 84.6% |
| Immigrants | Nigeria | 42.5 /100 | #179 | Average 84.6% |
| Immigrants | Netherlands | 42.1 /100 | #180 | Average 84.6% |
| Moroccans | 40.3 /100 | #181 | Average 84.6% |
| Barbadians | 36.7 /100 | #182 | Fair 84.6% |
| Immigrants | Canada | 35.0 /100 | #183 | Fair 84.6% |
| Immigrants | North America | 33.3 /100 | #184 | Fair 84.6% |
| Immigrants | Philippines | 31.5 /100 | #185 | Fair 84.6% |