Creek vs Immigrants from Western Africa Divorced or Separated
COMPARE
Creek
Immigrants from Western Africa
Divorced or Separated
Divorced or Separated Comparison
Creek
Immigrants from Western Africa
14.4%
DIVORCED OR SEPARATED
0.0/ 100
METRIC RATING
343rd/ 347
METRIC RANK
12.3%
DIVORCED OR SEPARATED
9.3/ 100
METRIC RATING
226th/ 347
METRIC RANK
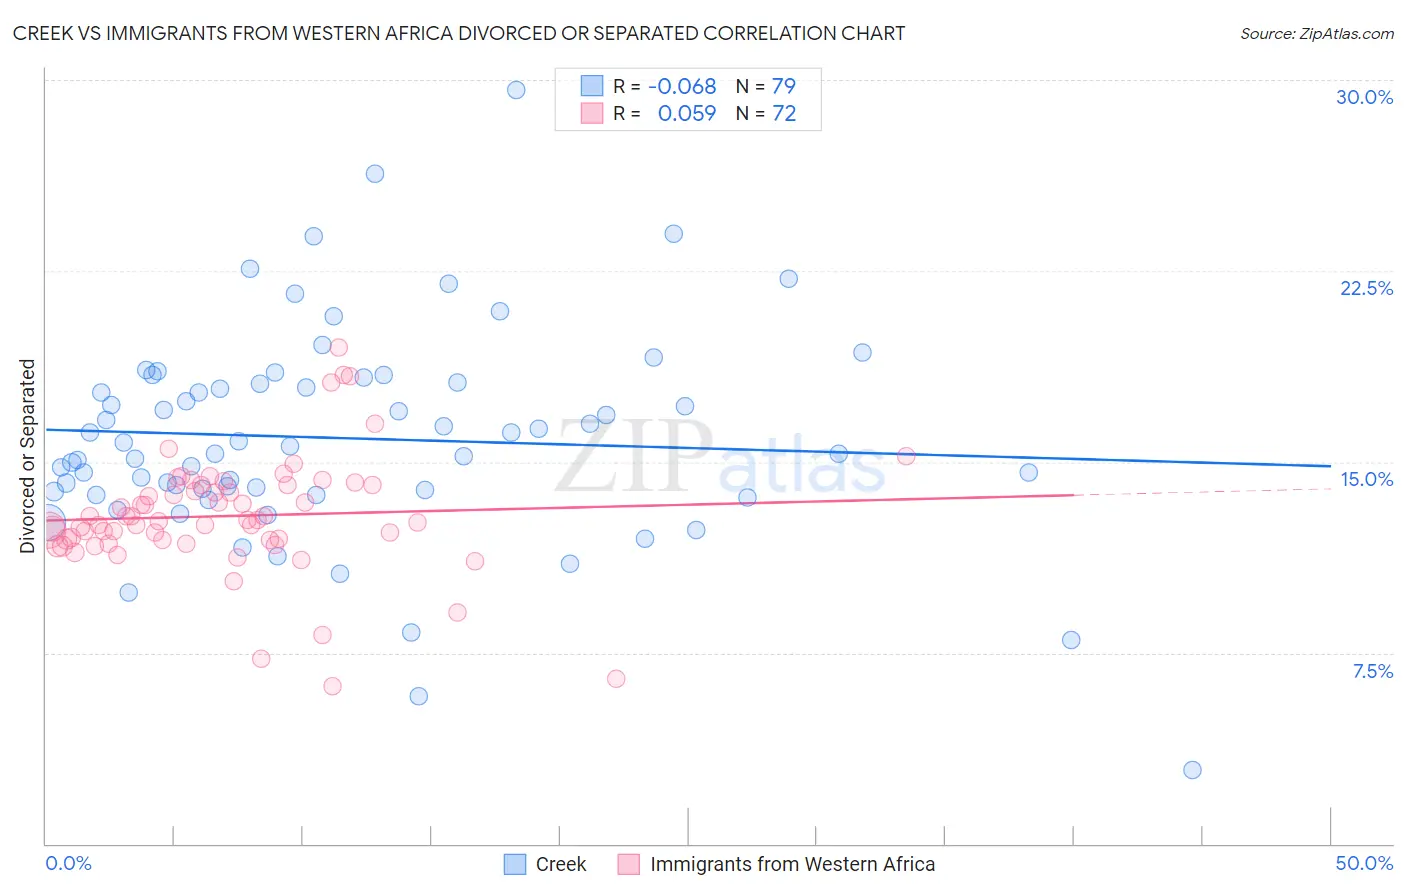
Creek vs Immigrants from Western Africa Divorced or Separated Correlation Chart
The statistical analysis conducted on geographies consisting of 178,467,072 people shows a slight negative correlation between the proportion of Creek and percentage of population currently divorced or separated in the United States with a correlation coefficient (R) of -0.068 and weighted average of 14.4%. Similarly, the statistical analysis conducted on geographies consisting of 357,656,491 people shows a slight positive correlation between the proportion of Immigrants from Western Africa and percentage of population currently divorced or separated in the United States with a correlation coefficient (R) of 0.059 and weighted average of 12.3%, a difference of 17.2%.
Divorced or Separated Correlation Summary
| Measurement | Creek | Immigrants from Western Africa |
| Minimum | 2.9% | 6.2% |
| Maximum | 29.6% | 19.5% |
| Range | 26.7% | 13.3% |
| Mean | 15.9% | 12.9% |
| Median | 15.6% | 12.7% |
| Interquartile 25% (IQ1) | 13.8% | 11.9% |
| Interquartile 75% (IQ3) | 18.1% | 14.1% |
| Interquartile Range (IQR) | 4.3% | 2.2% |
| Standard Deviation (Sample) | 4.2% | 2.3% |
| Standard Deviation (Population) | 4.2% | 2.3% |
Similar Demographics by Divorced or Separated
Demographics Similar to Creek by Divorced or Separated
In terms of divorced or separated, the demographic groups most similar to Creek are Cuban (14.5%, a difference of 0.68%), Kiowa (14.5%, a difference of 0.77%), Seminole (14.3%, a difference of 1.1%), Bahamian (14.2%, a difference of 1.2%), and Chickasaw (14.2%, a difference of 1.4%).
| Demographics | Rating | Rank | Divorced or Separated |
| Puerto Ricans | 0.0 /100 | #333 | Tragic 13.9% |
| Immigrants | Bahamas | 0.0 /100 | #334 | Tragic 13.9% |
| Dutch West Indians | 0.0 /100 | #335 | Tragic 14.0% |
| Shoshone | 0.0 /100 | #336 | Tragic 14.0% |
| Crow | 0.0 /100 | #337 | Tragic 14.1% |
| Choctaw | 0.0 /100 | #338 | Tragic 14.1% |
| Colville | 0.0 /100 | #339 | Tragic 14.2% |
| Chickasaw | 0.0 /100 | #340 | Tragic 14.2% |
| Bahamians | 0.0 /100 | #341 | Tragic 14.2% |
| Seminole | 0.0 /100 | #342 | Tragic 14.3% |
| Creek | 0.0 /100 | #343 | Tragic 14.4% |
| Cubans | 0.0 /100 | #344 | Tragic 14.5% |
| Kiowa | 0.0 /100 | #345 | Tragic 14.5% |
| Arapaho | 0.0 /100 | #346 | Tragic 14.8% |
| Immigrants | Cuba | 0.0 /100 | #347 | Tragic 15.2% |
Demographics Similar to Immigrants from Western Africa by Divorced or Separated
In terms of divorced or separated, the demographic groups most similar to Immigrants from Western Africa are Belgian (12.3%, a difference of 0.030%), Immigrants from the Azores (12.3%, a difference of 0.040%), Hmong (12.3%, a difference of 0.050%), Scandinavian (12.3%, a difference of 0.10%), and Immigrants from Cameroon (12.3%, a difference of 0.10%).
| Demographics | Rating | Rank | Divorced or Separated |
| Czechoslovakians | 11.7 /100 | #219 | Poor 12.3% |
| British | 11.6 /100 | #220 | Poor 12.3% |
| Guamanians/Chamorros | 11.3 /100 | #221 | Poor 12.3% |
| Bangladeshis | 10.5 /100 | #222 | Poor 12.3% |
| Scandinavians | 10.4 /100 | #223 | Poor 12.3% |
| Immigrants | Azores | 9.7 /100 | #224 | Tragic 12.3% |
| Belgians | 9.7 /100 | #225 | Tragic 12.3% |
| Immigrants | Western Africa | 9.3 /100 | #226 | Tragic 12.3% |
| Hmong | 8.8 /100 | #227 | Tragic 12.3% |
| Immigrants | Cameroon | 8.3 /100 | #228 | Tragic 12.3% |
| Immigrants | Sudan | 8.2 /100 | #229 | Tragic 12.3% |
| Yakama | 7.8 /100 | #230 | Tragic 12.3% |
| Yugoslavians | 6.6 /100 | #231 | Tragic 12.3% |
| Canadians | 5.3 /100 | #232 | Tragic 12.4% |
| Malaysians | 4.8 /100 | #233 | Tragic 12.4% |