Immigrants from South Eastern Asia vs Immigrants from Trinidad and Tobago In Labor Force | Age 25-29
COMPARE
Immigrants from South Eastern Asia
Immigrants from Trinidad and Tobago
In Labor Force | Age 25-29
In Labor Force | Age 25-29 Comparison
Immigrants from South Eastern Asia
Immigrants from Trinidad and Tobago
84.4%
IN LABOR FORCE | AGE 25-29
19.5/ 100
METRIC RATING
196th/ 347
METRIC RANK
83.7%
IN LABOR FORCE | AGE 25-29
0.2/ 100
METRIC RATING
253rd/ 347
METRIC RANK
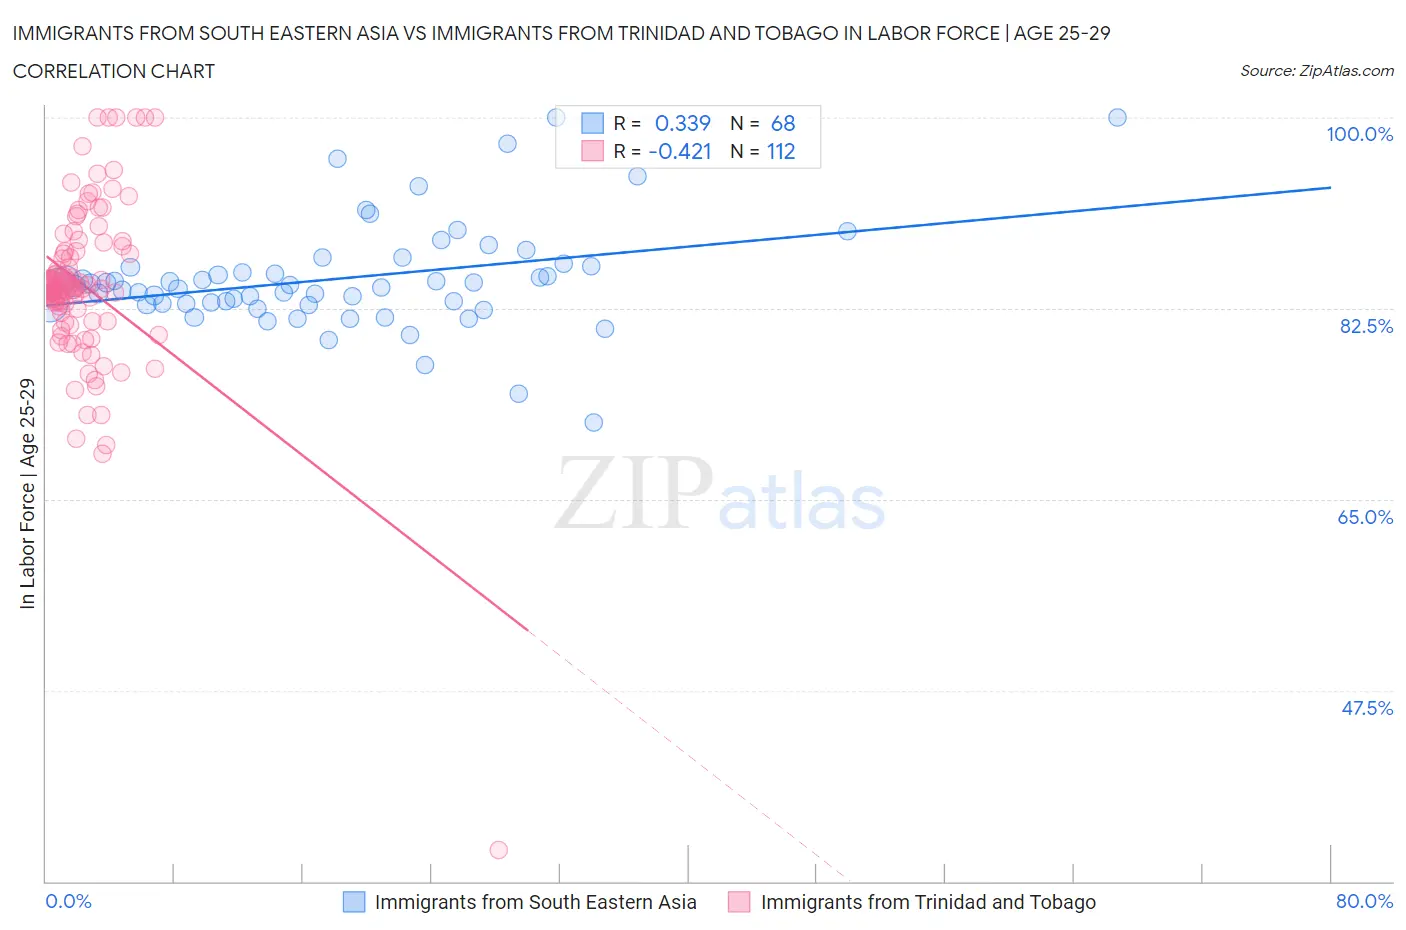
Immigrants from South Eastern Asia vs Immigrants from Trinidad and Tobago In Labor Force | Age 25-29 Correlation Chart
The statistical analysis conducted on geographies consisting of 512,343,229 people shows a mild positive correlation between the proportion of Immigrants from South Eastern Asia and labor force participation rate among population between the ages 25 and 29 in the United States with a correlation coefficient (R) of 0.339 and weighted average of 84.4%. Similarly, the statistical analysis conducted on geographies consisting of 223,499,686 people shows a moderate negative correlation between the proportion of Immigrants from Trinidad and Tobago and labor force participation rate among population between the ages 25 and 29 in the United States with a correlation coefficient (R) of -0.421 and weighted average of 83.7%, a difference of 0.89%.
In Labor Force | Age 25-29 Correlation Summary
| Measurement | Immigrants from South Eastern Asia | Immigrants from Trinidad and Tobago |
| Minimum | 72.0% | 32.9% |
| Maximum | 100.0% | 100.0% |
| Range | 28.0% | 67.1% |
| Mean | 85.2% | 84.6% |
| Median | 84.6% | 84.5% |
| Interquartile 25% (IQ1) | 82.9% | 82.3% |
| Interquartile 75% (IQ3) | 86.3% | 87.7% |
| Interquartile Range (IQR) | 3.4% | 5.4% |
| Standard Deviation (Sample) | 4.9% | 8.0% |
| Standard Deviation (Population) | 4.9% | 8.0% |
Similar Demographics by In Labor Force | Age 25-29
Demographics Similar to Immigrants from South Eastern Asia by In Labor Force | Age 25-29
In terms of in labor force | age 25-29, the demographic groups most similar to Immigrants from South Eastern Asia are Tlingit-Haida (84.4%, a difference of 0.0%), Immigrants from Israel (84.4%, a difference of 0.010%), Immigrants from Iraq (84.4%, a difference of 0.010%), Immigrants from Germany (84.4%, a difference of 0.010%), and Portuguese (84.4%, a difference of 0.020%).
| Demographics | Rating | Rank | In Labor Force | Age 25-29 |
| Moroccans | 32.6 /100 | #189 | Fair 84.5% |
| Welsh | 31.1 /100 | #190 | Fair 84.5% |
| Zimbabweans | 28.7 /100 | #191 | Fair 84.5% |
| English | 25.8 /100 | #192 | Fair 84.5% |
| South American Indians | 25.0 /100 | #193 | Fair 84.5% |
| Portuguese | 21.2 /100 | #194 | Fair 84.4% |
| Immigrants | Israel | 20.8 /100 | #195 | Fair 84.4% |
| Immigrants | South Eastern Asia | 19.5 /100 | #196 | Poor 84.4% |
| Tlingit-Haida | 19.3 /100 | #197 | Poor 84.4% |
| Immigrants | Iraq | 19.0 /100 | #198 | Poor 84.4% |
| Immigrants | Germany | 18.3 /100 | #199 | Poor 84.4% |
| Immigrants | Kazakhstan | 17.5 /100 | #200 | Poor 84.4% |
| Laotians | 16.6 /100 | #201 | Poor 84.4% |
| Afghans | 15.9 /100 | #202 | Poor 84.4% |
| Immigrants | Afghanistan | 15.6 /100 | #203 | Poor 84.4% |
Demographics Similar to Immigrants from Trinidad and Tobago by In Labor Force | Age 25-29
In terms of in labor force | age 25-29, the demographic groups most similar to Immigrants from Trinidad and Tobago are Guatemalan (83.7%, a difference of 0.0%), Spaniard (83.7%, a difference of 0.0%), Bahamian (83.7%, a difference of 0.010%), Haitian (83.7%, a difference of 0.010%), and Immigrants from Haiti (83.7%, a difference of 0.020%).
| Demographics | Rating | Rank | In Labor Force | Age 25-29 |
| Cree | 0.3 /100 | #246 | Tragic 83.8% |
| Immigrants | El Salvador | 0.3 /100 | #247 | Tragic 83.7% |
| Immigrants | Nonimmigrants | 0.3 /100 | #248 | Tragic 83.7% |
| Hmong | 0.3 /100 | #249 | Tragic 83.7% |
| Central Americans | 0.2 /100 | #250 | Tragic 83.7% |
| Bahamians | 0.2 /100 | #251 | Tragic 83.7% |
| Guatemalans | 0.2 /100 | #252 | Tragic 83.7% |
| Immigrants | Trinidad and Tobago | 0.2 /100 | #253 | Tragic 83.7% |
| Spaniards | 0.2 /100 | #254 | Tragic 83.7% |
| Haitians | 0.2 /100 | #255 | Tragic 83.7% |
| Immigrants | Haiti | 0.2 /100 | #256 | Tragic 83.7% |
| Delaware | 0.2 /100 | #257 | Tragic 83.7% |
| Immigrants | Guatemala | 0.1 /100 | #258 | Tragic 83.6% |
| Spanish | 0.1 /100 | #259 | Tragic 83.6% |
| Immigrants | Bahamas | 0.1 /100 | #260 | Tragic 83.6% |