Creek vs Immigrants from Oceania 8th Grade
COMPARE
Creek
Immigrants from Oceania
8th Grade
8th Grade Comparison
Creek
Immigrants from Oceania
96.6%
8TH GRADE
99.7/ 100
METRIC RATING
68th/ 347
METRIC RANK
95.3%
8TH GRADE
7.1/ 100
METRIC RATING
223rd/ 347
METRIC RANK
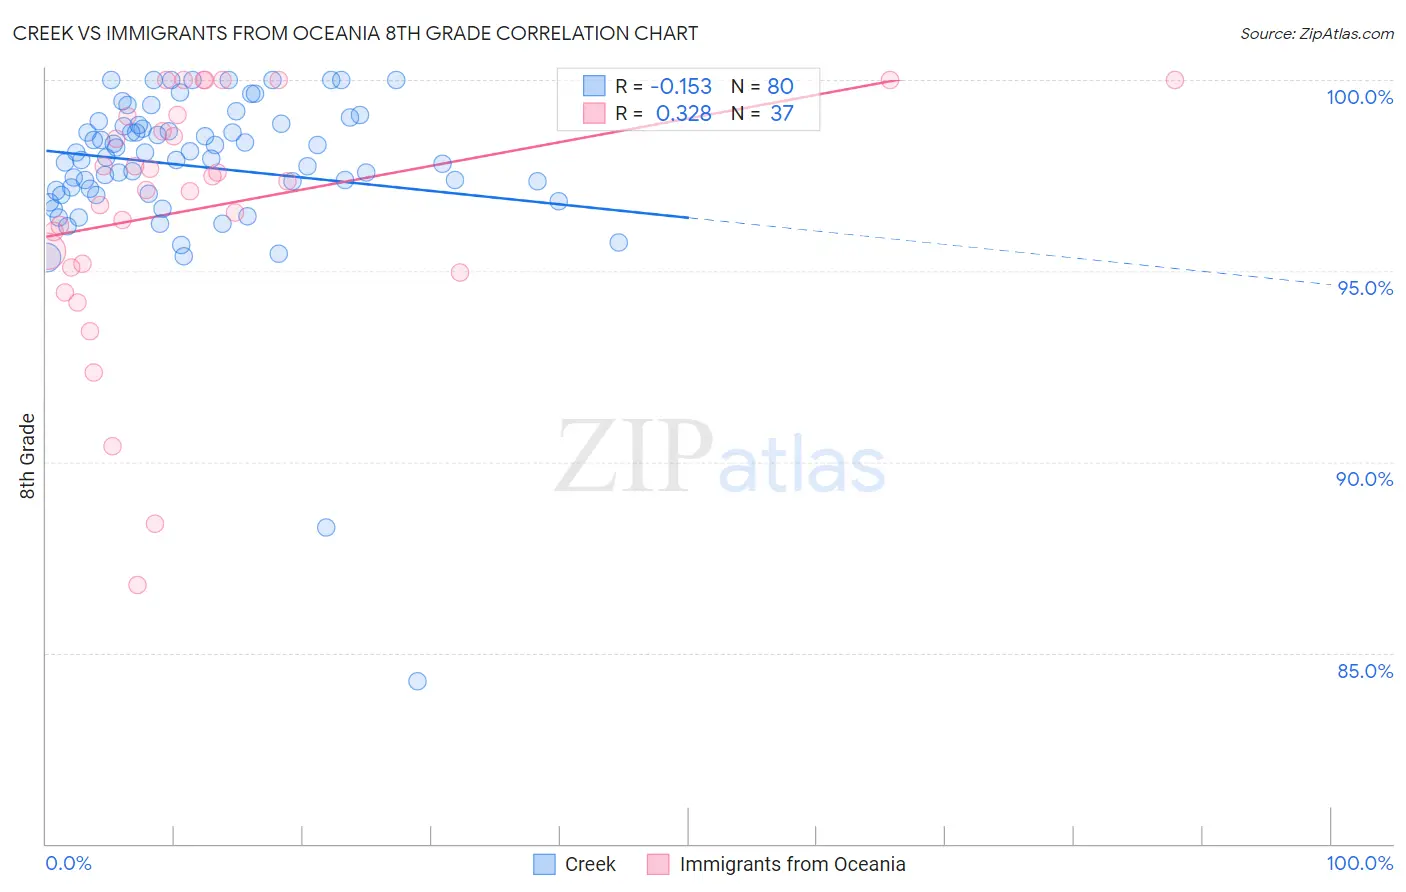
Creek vs Immigrants from Oceania 8th Grade Correlation Chart
The statistical analysis conducted on geographies consisting of 178,480,629 people shows a poor negative correlation between the proportion of Creek and percentage of population with at least 8th grade education in the United States with a correlation coefficient (R) of -0.153 and weighted average of 96.6%. Similarly, the statistical analysis conducted on geographies consisting of 305,521,521 people shows a mild positive correlation between the proportion of Immigrants from Oceania and percentage of population with at least 8th grade education in the United States with a correlation coefficient (R) of 0.328 and weighted average of 95.3%, a difference of 1.3%.
8th Grade Correlation Summary
| Measurement | Creek | Immigrants from Oceania |
| Minimum | 84.3% | 86.8% |
| Maximum | 100.0% | 100.0% |
| Range | 15.7% | 13.2% |
| Mean | 97.7% | 96.6% |
| Median | 98.0% | 97.3% |
| Interquartile 25% (IQ1) | 97.1% | 95.1% |
| Interquartile 75% (IQ3) | 98.8% | 99.1% |
| Interquartile Range (IQR) | 1.8% | 3.9% |
| Standard Deviation (Sample) | 2.3% | 3.2% |
| Standard Deviation (Population) | 2.2% | 3.2% |
Similar Demographics by 8th Grade
Demographics Similar to Creek by 8th Grade
In terms of 8th grade, the demographic groups most similar to Creek are American (96.6%, a difference of 0.0%), Iranian (96.6%, a difference of 0.010%), Immigrants from India (96.6%, a difference of 0.020%), Native Hawaiian (96.6%, a difference of 0.020%), and Canadian (96.6%, a difference of 0.020%).
| Demographics | Rating | Rank | 8th Grade |
| Immigrants | Austria | 99.8 /100 | #61 | Exceptional 96.7% |
| Whites/Caucasians | 99.8 /100 | #62 | Exceptional 96.7% |
| Ukrainians | 99.7 /100 | #63 | Exceptional 96.7% |
| Immigrants | India | 99.7 /100 | #64 | Exceptional 96.6% |
| Native Hawaiians | 99.7 /100 | #65 | Exceptional 96.6% |
| Canadians | 99.7 /100 | #66 | Exceptional 96.6% |
| Iranians | 99.7 /100 | #67 | Exceptional 96.6% |
| Creek | 99.7 /100 | #68 | Exceptional 96.6% |
| Americans | 99.7 /100 | #69 | Exceptional 96.6% |
| Immigrants | Lithuania | 99.6 /100 | #70 | Exceptional 96.6% |
| New Zealanders | 99.5 /100 | #71 | Exceptional 96.6% |
| Immigrants | England | 99.5 /100 | #72 | Exceptional 96.6% |
| Arapaho | 99.5 /100 | #73 | Exceptional 96.6% |
| Immigrants | Ireland | 99.5 /100 | #74 | Exceptional 96.5% |
| Zimbabweans | 99.4 /100 | #75 | Exceptional 96.5% |
Demographics Similar to Immigrants from Oceania by 8th Grade
In terms of 8th grade, the demographic groups most similar to Immigrants from Oceania are Immigrants from Malaysia (95.3%, a difference of 0.0%), Immigrants from Southern Europe (95.3%, a difference of 0.010%), Immigrants from Syria (95.3%, a difference of 0.010%), Dutch West Indian (95.4%, a difference of 0.020%), and Spanish American (95.4%, a difference of 0.020%).
| Demographics | Rating | Rank | 8th Grade |
| Samoans | 8.4 /100 | #216 | Tragic 95.4% |
| Immigrants | Eastern Asia | 8.3 /100 | #217 | Tragic 95.4% |
| Dutch West Indians | 8.1 /100 | #218 | Tragic 95.4% |
| Spanish Americans | 8.0 /100 | #219 | Tragic 95.4% |
| Immigrants | Southern Europe | 7.7 /100 | #220 | Tragic 95.3% |
| Immigrants | Syria | 7.4 /100 | #221 | Tragic 95.3% |
| Immigrants | Malaysia | 7.3 /100 | #222 | Tragic 95.3% |
| Immigrants | Oceania | 7.1 /100 | #223 | Tragic 95.3% |
| Immigrants | Western Asia | 6.0 /100 | #224 | Tragic 95.3% |
| Sub-Saharan Africans | 6.0 /100 | #225 | Tragic 95.3% |
| Navajo | 5.7 /100 | #226 | Tragic 95.3% |
| Bahamians | 5.6 /100 | #227 | Tragic 95.3% |
| Immigrants | Eastern Africa | 5.6 /100 | #228 | Tragic 95.3% |
| Immigrants | Indonesia | 4.4 /100 | #229 | Tragic 95.3% |
| Immigrants | Panama | 4.1 /100 | #230 | Tragic 95.2% |