Creek vs Immigrants from Oceania Unemployment Among Ages 25 to 29 years
COMPARE
Creek
Immigrants from Oceania
Unemployment Among Ages 25 to 29 years
Unemployment Among Ages 25 to 29 years Comparison
Creek
Immigrants from Oceania
7.6%
UNEMPLOYMENT AMONG AGES 25 TO 29 YEARS
0.0/ 100
METRIC RATING
283rd/ 347
METRIC RANK
6.4%
UNEMPLOYMENT AMONG AGES 25 TO 29 YEARS
94.1/ 100
METRIC RATING
89th/ 347
METRIC RANK
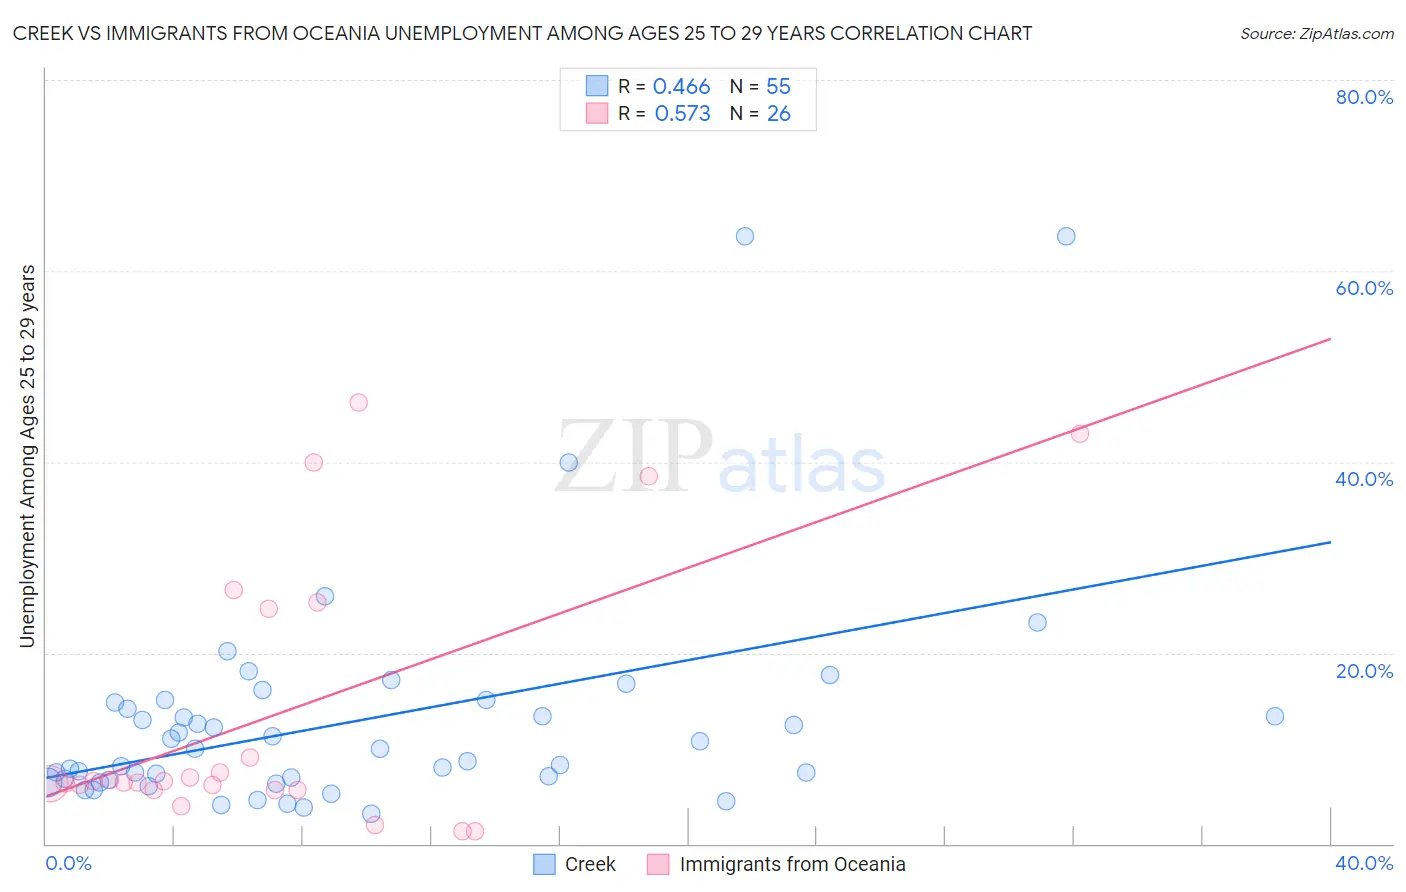
Creek vs Immigrants from Oceania Unemployment Among Ages 25 to 29 years Correlation Chart
The statistical analysis conducted on geographies consisting of 172,938,498 people shows a moderate positive correlation between the proportion of Creek and unemployment rate among population between the ages 25 and 29 in the United States with a correlation coefficient (R) of 0.466 and weighted average of 7.6%. Similarly, the statistical analysis conducted on geographies consisting of 293,361,593 people shows a substantial positive correlation between the proportion of Immigrants from Oceania and unemployment rate among population between the ages 25 and 29 in the United States with a correlation coefficient (R) of 0.573 and weighted average of 6.4%, a difference of 19.0%.
Unemployment Among Ages 25 to 29 years Correlation Summary
| Measurement | Creek | Immigrants from Oceania |
| Minimum | 3.2% | 1.3% |
| Maximum | 63.6% | 46.2% |
| Range | 60.4% | 44.9% |
| Mean | 12.9% | 13.5% |
| Median | 10.0% | 6.5% |
| Interquartile 25% (IQ1) | 6.7% | 5.7% |
| Interquartile 75% (IQ3) | 14.8% | 24.6% |
| Interquartile Range (IQR) | 8.1% | 18.9% |
| Standard Deviation (Sample) | 11.8% | 14.1% |
| Standard Deviation (Population) | 11.7% | 13.8% |
Similar Demographics by Unemployment Among Ages 25 to 29 years
Demographics Similar to Creek by Unemployment Among Ages 25 to 29 years
In terms of unemployment among ages 25 to 29 years, the demographic groups most similar to Creek are Cherokee (7.6%, a difference of 0.010%), Senegalese (7.6%, a difference of 0.13%), Immigrants from Senegal (7.6%, a difference of 0.17%), Vietnamese (7.6%, a difference of 0.22%), and Immigrants from Bangladesh (7.5%, a difference of 0.34%).
| Demographics | Rating | Rank | Unemployment Among Ages 25 to 29 years |
| French American Indians | 0.0 /100 | #276 | Tragic 7.5% |
| Iroquois | 0.0 /100 | #277 | Tragic 7.5% |
| Mexicans | 0.0 /100 | #278 | Tragic 7.5% |
| Nepalese | 0.0 /100 | #279 | Tragic 7.5% |
| Immigrants | Caribbean | 0.0 /100 | #280 | Tragic 7.5% |
| Immigrants | Bangladesh | 0.0 /100 | #281 | Tragic 7.5% |
| Immigrants | Senegal | 0.0 /100 | #282 | Tragic 7.6% |
| Creek | 0.0 /100 | #283 | Tragic 7.6% |
| Cherokee | 0.0 /100 | #284 | Tragic 7.6% |
| Senegalese | 0.0 /100 | #285 | Tragic 7.6% |
| Vietnamese | 0.0 /100 | #286 | Tragic 7.6% |
| Immigrants | Mexico | 0.0 /100 | #287 | Tragic 7.6% |
| Africans | 0.0 /100 | #288 | Tragic 7.6% |
| Belizeans | 0.0 /100 | #289 | Tragic 7.7% |
| Armenians | 0.0 /100 | #290 | Tragic 7.7% |
Demographics Similar to Immigrants from Oceania by Unemployment Among Ages 25 to 29 years
In terms of unemployment among ages 25 to 29 years, the demographic groups most similar to Immigrants from Oceania are Lebanese (6.4%, a difference of 0.070%), Egyptian (6.4%, a difference of 0.080%), Immigrants from Indonesia (6.4%, a difference of 0.11%), Immigrants from North Macedonia (6.4%, a difference of 0.14%), and Australian (6.4%, a difference of 0.14%).
| Demographics | Rating | Rank | Unemployment Among Ages 25 to 29 years |
| Immigrants | Poland | 95.7 /100 | #82 | Exceptional 6.3% |
| Slovenes | 95.3 /100 | #83 | Exceptional 6.3% |
| Immigrants | Spain | 95.2 /100 | #84 | Exceptional 6.3% |
| Immigrants | Sweden | 95.1 /100 | #85 | Exceptional 6.3% |
| Immigrants | Asia | 94.9 /100 | #86 | Exceptional 6.3% |
| Marshallese | 94.7 /100 | #87 | Exceptional 6.4% |
| Immigrants | Indonesia | 94.5 /100 | #88 | Exceptional 6.4% |
| Immigrants | Oceania | 94.1 /100 | #89 | Exceptional 6.4% |
| Lebanese | 93.9 /100 | #90 | Exceptional 6.4% |
| Egyptians | 93.9 /100 | #91 | Exceptional 6.4% |
| Immigrants | North Macedonia | 93.6 /100 | #92 | Exceptional 6.4% |
| Australians | 93.6 /100 | #93 | Exceptional 6.4% |
| Zimbabweans | 93.5 /100 | #94 | Exceptional 6.4% |
| Afghans | 92.5 /100 | #95 | Exceptional 6.4% |
| Immigrants | Brazil | 92.1 /100 | #96 | Exceptional 6.4% |