Creek vs Immigrants from Yemen In Labor Force | Age 16-19
COMPARE
Creek
Immigrants from Yemen
In Labor Force | Age 16-19
In Labor Force | Age 16-19 Comparison
Creek
Immigrants from Yemen
39.1%
IN LABOR FORCE | AGE 16-19
99.6/ 100
METRIC RATING
85th/ 347
METRIC RANK
31.5%
IN LABOR FORCE | AGE 16-19
0.0/ 100
METRIC RATING
318th/ 347
METRIC RANK
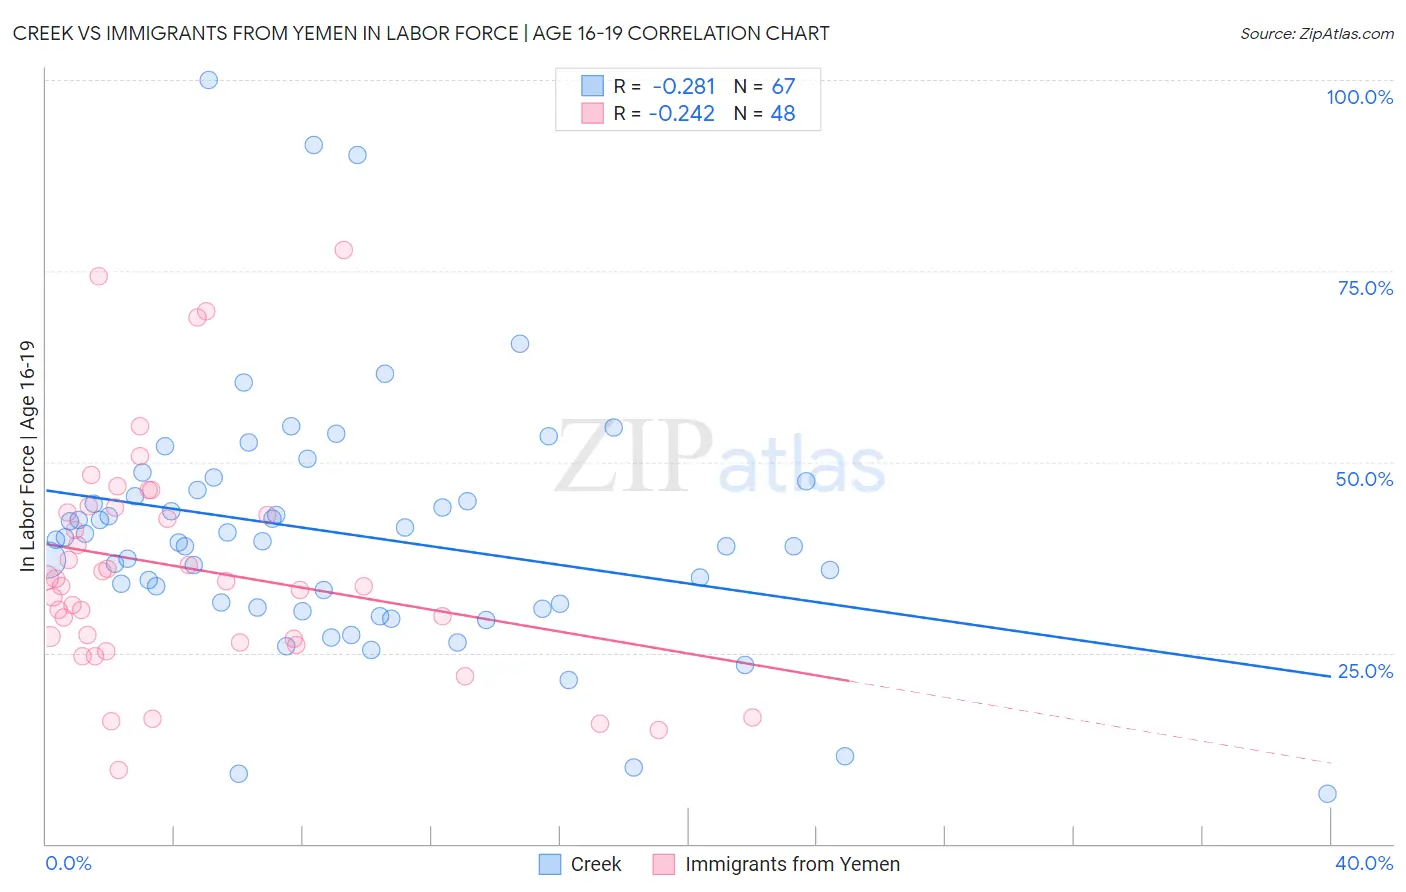
Creek vs Immigrants from Yemen In Labor Force | Age 16-19 Correlation Chart
The statistical analysis conducted on geographies consisting of 178,315,615 people shows a weak negative correlation between the proportion of Creek and labor force participation rate among population between the ages 16 and 19 in the United States with a correlation coefficient (R) of -0.281 and weighted average of 39.1%. Similarly, the statistical analysis conducted on geographies consisting of 82,404,771 people shows a weak negative correlation between the proportion of Immigrants from Yemen and labor force participation rate among population between the ages 16 and 19 in the United States with a correlation coefficient (R) of -0.242 and weighted average of 31.5%, a difference of 24.2%.
In Labor Force | Age 16-19 Correlation Summary
| Measurement | Creek | Immigrants from Yemen |
| Minimum | 6.5% | 9.6% |
| Maximum | 100.0% | 77.8% |
| Range | 93.5% | 68.2% |
| Mean | 40.6% | 36.1% |
| Median | 39.7% | 34.1% |
| Interquartile 25% (IQ1) | 30.9% | 26.6% |
| Interquartile 75% (IQ3) | 46.2% | 43.7% |
| Interquartile Range (IQR) | 15.3% | 17.0% |
| Standard Deviation (Sample) | 16.6% | 15.1% |
| Standard Deviation (Population) | 16.5% | 14.9% |
Similar Demographics by In Labor Force | Age 16-19
Demographics Similar to Creek by In Labor Force | Age 16-19
In terms of in labor force | age 16-19, the demographic groups most similar to Creek are Samoan (39.1%, a difference of 0.020%), Immigrants from Germany (39.1%, a difference of 0.10%), Immigrants from Uganda (39.2%, a difference of 0.15%), Puget Sound Salish (39.1%, a difference of 0.17%), and Alaska Native (39.1%, a difference of 0.18%).
| Demographics | Rating | Rank | In Labor Force | Age 16-19 |
| Austrians | 99.8 /100 | #78 | Exceptional 39.5% |
| Marshallese | 99.8 /100 | #79 | Exceptional 39.5% |
| Immigrants | Iraq | 99.8 /100 | #80 | Exceptional 39.4% |
| Shoshone | 99.7 /100 | #81 | Exceptional 39.3% |
| Basques | 99.7 /100 | #82 | Exceptional 39.3% |
| Spanish | 99.7 /100 | #83 | Exceptional 39.3% |
| Immigrants | Uganda | 99.7 /100 | #84 | Exceptional 39.2% |
| Creek | 99.6 /100 | #85 | Exceptional 39.1% |
| Samoans | 99.6 /100 | #86 | Exceptional 39.1% |
| Immigrants | Germany | 99.6 /100 | #87 | Exceptional 39.1% |
| Puget Sound Salish | 99.6 /100 | #88 | Exceptional 39.1% |
| Alaska Natives | 99.6 /100 | #89 | Exceptional 39.1% |
| Immigrants | Burma/Myanmar | 99.5 /100 | #90 | Exceptional 39.0% |
| Spanish Americans | 99.5 /100 | #91 | Exceptional 39.0% |
| Osage | 99.4 /100 | #92 | Exceptional 39.0% |
Demographics Similar to Immigrants from Yemen by In Labor Force | Age 16-19
In terms of in labor force | age 16-19, the demographic groups most similar to Immigrants from Yemen are Soviet Union (31.4%, a difference of 0.32%), Immigrants from Nicaragua (31.6%, a difference of 0.34%), Ecuadorian (31.4%, a difference of 0.38%), Filipino (31.7%, a difference of 0.53%), and Immigrants from West Indies (31.7%, a difference of 0.62%).
| Demographics | Rating | Rank | In Labor Force | Age 16-19 |
| Indians (Asian) | 0.0 /100 | #311 | Tragic 31.9% |
| Immigrants | Belize | 0.0 /100 | #312 | Tragic 31.8% |
| Hopi | 0.0 /100 | #313 | Tragic 31.8% |
| Cubans | 0.0 /100 | #314 | Tragic 31.8% |
| Immigrants | West Indies | 0.0 /100 | #315 | Tragic 31.7% |
| Filipinos | 0.0 /100 | #316 | Tragic 31.7% |
| Immigrants | Nicaragua | 0.0 /100 | #317 | Tragic 31.6% |
| Immigrants | Yemen | 0.0 /100 | #318 | Tragic 31.5% |
| Soviet Union | 0.0 /100 | #319 | Tragic 31.4% |
| Ecuadorians | 0.0 /100 | #320 | Tragic 31.4% |
| West Indians | 0.0 /100 | #321 | Tragic 31.3% |
| Tohono O'odham | 0.0 /100 | #322 | Tragic 31.3% |
| Immigrants | Caribbean | 0.0 /100 | #323 | Tragic 31.2% |
| Dominicans | 0.0 /100 | #324 | Tragic 31.2% |
| Immigrants | China | 0.0 /100 | #325 | Tragic 31.1% |