Jamaican vs Crow In Labor Force | Age 25-29
COMPARE
Jamaican
Crow
In Labor Force | Age 25-29
In Labor Force | Age 25-29 Comparison
Jamaicans
Crow
83.9%
IN LABOR FORCE | AGE 25-29
0.8/ 100
METRIC RATING
239th/ 347
METRIC RANK
78.6%
IN LABOR FORCE | AGE 25-29
0.0/ 100
METRIC RATING
337th/ 347
METRIC RANK
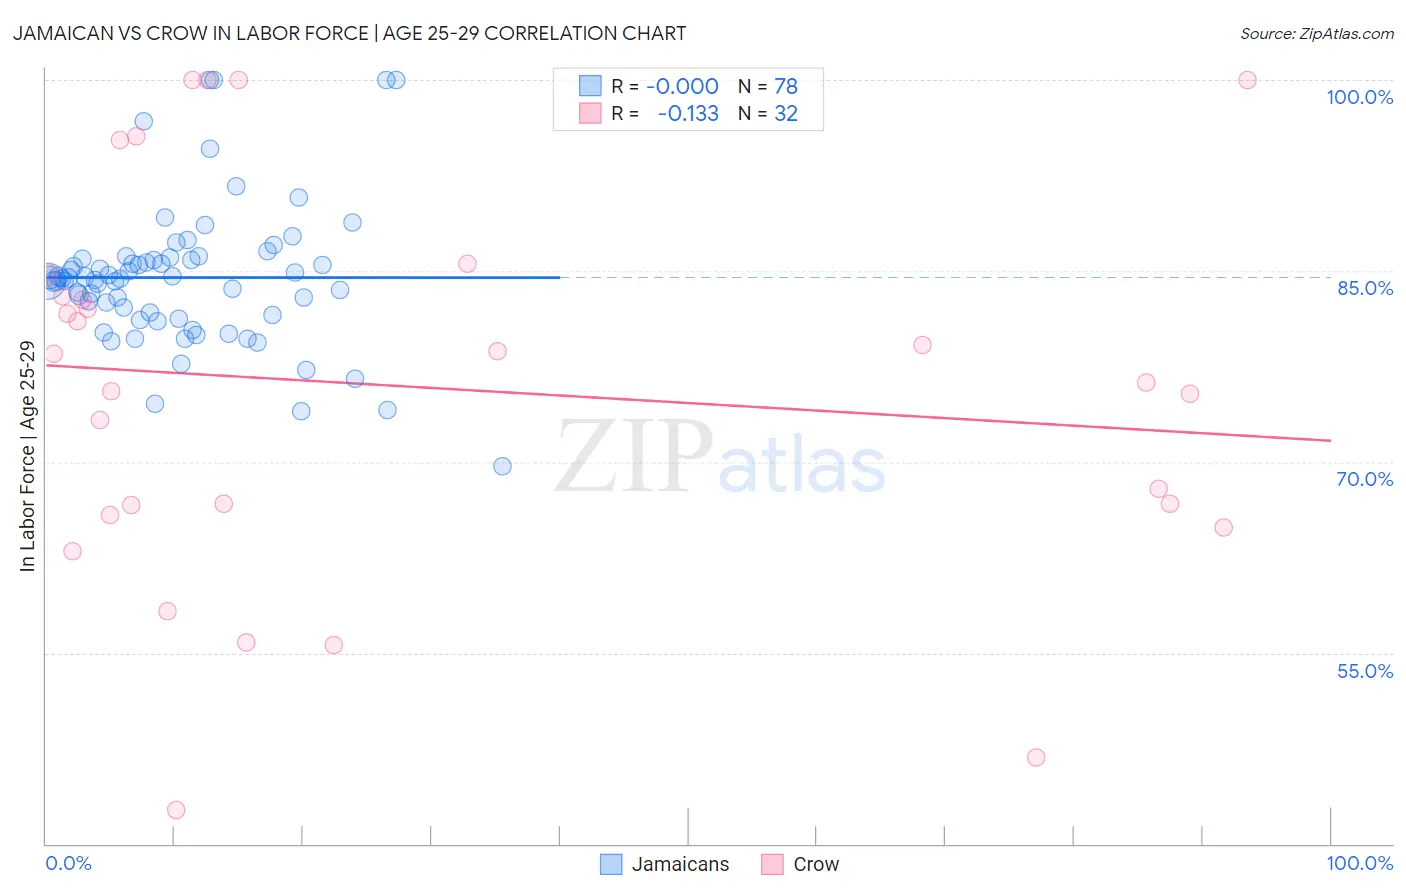
Jamaican vs Crow In Labor Force | Age 25-29 Correlation Chart
The statistical analysis conducted on geographies consisting of 367,887,997 people shows no correlation between the proportion of Jamaicans and labor force participation rate among population between the ages 25 and 29 in the United States with a correlation coefficient (R) of -0.000 and weighted average of 83.9%. Similarly, the statistical analysis conducted on geographies consisting of 59,193,680 people shows a poor negative correlation between the proportion of Crow and labor force participation rate among population between the ages 25 and 29 in the United States with a correlation coefficient (R) of -0.133 and weighted average of 78.6%, a difference of 6.7%.
In Labor Force | Age 25-29 Correlation Summary
| Measurement | Jamaican | Crow |
| Minimum | 69.7% | 42.7% |
| Maximum | 100.0% | 100.0% |
| Range | 30.3% | 57.3% |
| Mean | 84.5% | 75.9% |
| Median | 84.4% | 77.3% |
| Interquartile 25% (IQ1) | 81.6% | 66.2% |
| Interquartile 75% (IQ3) | 86.0% | 83.9% |
| Interquartile Range (IQR) | 4.4% | 17.6% |
| Standard Deviation (Sample) | 5.6% | 15.3% |
| Standard Deviation (Population) | 5.5% | 15.1% |
Similar Demographics by In Labor Force | Age 25-29
Demographics Similar to Jamaicans by In Labor Force | Age 25-29
In terms of in labor force | age 25-29, the demographic groups most similar to Jamaicans are Immigrants from Uzbekistan (83.9%, a difference of 0.0%), Trinidadian and Tobagonian (83.9%, a difference of 0.0%), Immigrants (83.9%, a difference of 0.030%), Alsatian (83.9%, a difference of 0.030%), and Iraqi (83.9%, a difference of 0.040%).
| Demographics | Rating | Rank | In Labor Force | Age 25-29 |
| Panamanians | 4.5 /100 | #232 | Tragic 84.2% |
| Immigrants | Western Asia | 2.7 /100 | #233 | Tragic 84.1% |
| Barbadians | 1.0 /100 | #234 | Tragic 83.9% |
| Iraqis | 0.9 /100 | #235 | Tragic 83.9% |
| Guamanians/Chamorros | 0.9 /100 | #236 | Tragic 83.9% |
| Immigrants | Immigrants | 0.9 /100 | #237 | Tragic 83.9% |
| Immigrants | Uzbekistan | 0.8 /100 | #238 | Tragic 83.9% |
| Jamaicans | 0.8 /100 | #239 | Tragic 83.9% |
| Trinidadians and Tobagonians | 0.7 /100 | #240 | Tragic 83.9% |
| Alsatians | 0.7 /100 | #241 | Tragic 83.9% |
| U.S. Virgin Islanders | 0.6 /100 | #242 | Tragic 83.8% |
| Salvadorans | 0.5 /100 | #243 | Tragic 83.8% |
| Immigrants | Jamaica | 0.4 /100 | #244 | Tragic 83.8% |
| Iroquois | 0.4 /100 | #245 | Tragic 83.8% |
| Cree | 0.3 /100 | #246 | Tragic 83.8% |
Demographics Similar to Crow by In Labor Force | Age 25-29
In terms of in labor force | age 25-29, the demographic groups most similar to Crow are Lumbee (78.3%, a difference of 0.37%), Immigrants from Yemen (78.2%, a difference of 0.49%), Paiute (78.1%, a difference of 0.65%), Apache (79.2%, a difference of 0.76%), and Native/Alaskan (79.3%, a difference of 0.83%).
| Demographics | Rating | Rank | In Labor Force | Age 25-29 |
| Puerto Ricans | 0.0 /100 | #330 | Tragic 80.4% |
| Cheyenne | 0.0 /100 | #331 | Tragic 80.3% |
| Inupiat | 0.0 /100 | #332 | Tragic 79.8% |
| Sioux | 0.0 /100 | #333 | Tragic 79.7% |
| Yuman | 0.0 /100 | #334 | Tragic 79.3% |
| Natives/Alaskans | 0.0 /100 | #335 | Tragic 79.3% |
| Apache | 0.0 /100 | #336 | Tragic 79.2% |
| Crow | 0.0 /100 | #337 | Tragic 78.6% |
| Lumbee | 0.0 /100 | #338 | Tragic 78.3% |
| Immigrants | Yemen | 0.0 /100 | #339 | Tragic 78.2% |
| Paiute | 0.0 /100 | #340 | Tragic 78.1% |
| Tohono O'odham | 0.0 /100 | #341 | Tragic 77.5% |
| Pueblo | 0.0 /100 | #342 | Tragic 77.5% |
| Arapaho | 0.0 /100 | #343 | Tragic 76.6% |
| Hopi | 0.0 /100 | #344 | Tragic 76.5% |