Immigrants from Netherlands vs Crow In Labor Force | Age 25-29
COMPARE
Immigrants from Netherlands
Crow
In Labor Force | Age 25-29
In Labor Force | Age 25-29 Comparison
Immigrants from Netherlands
Crow
85.1%
IN LABOR FORCE | AGE 25-29
94.6/ 100
METRIC RATING
95th/ 347
METRIC RANK
78.6%
IN LABOR FORCE | AGE 25-29
0.0/ 100
METRIC RATING
337th/ 347
METRIC RANK
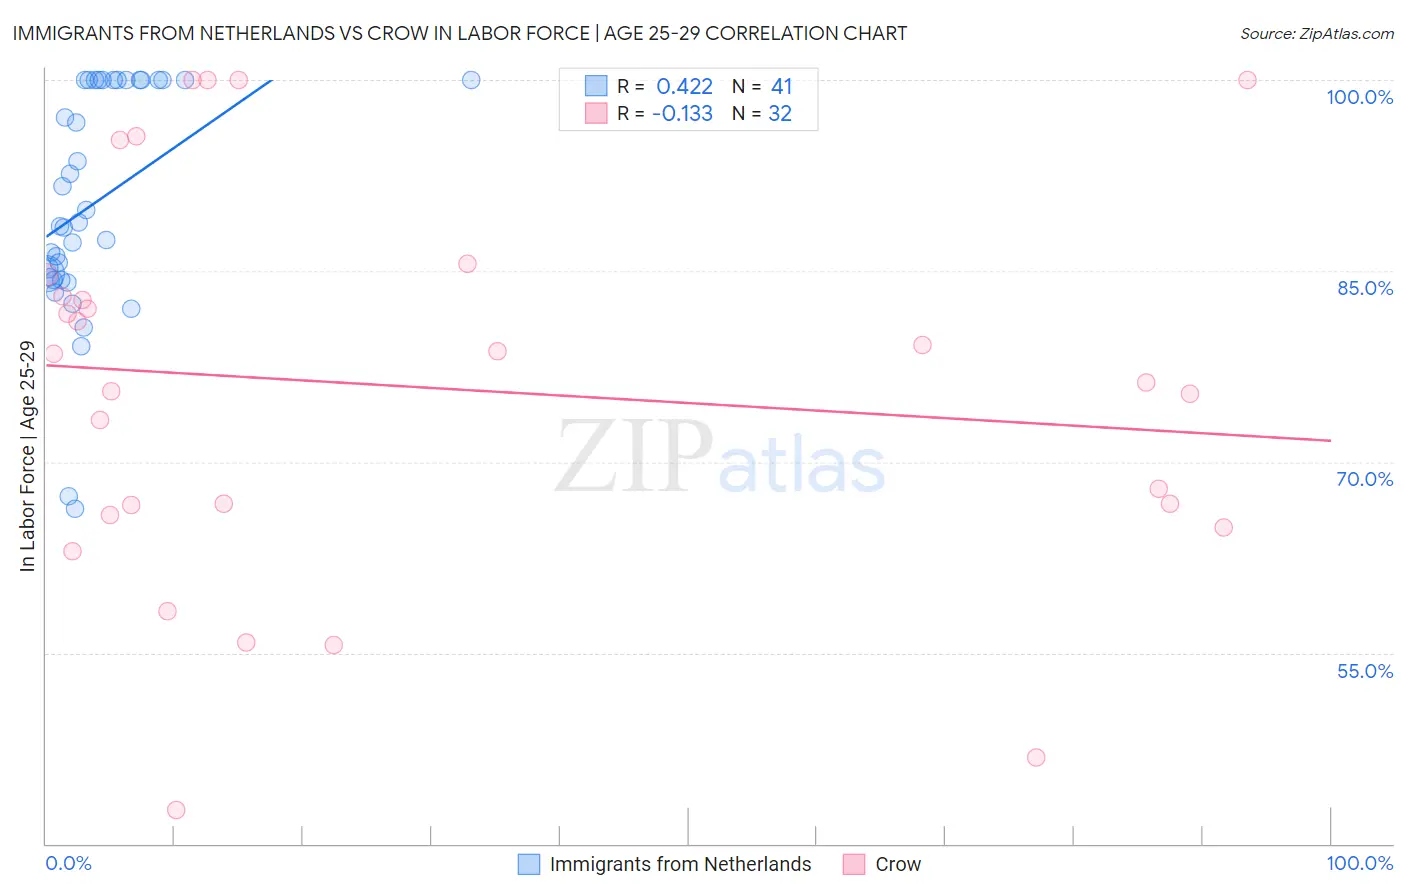
Immigrants from Netherlands vs Crow In Labor Force | Age 25-29 Correlation Chart
The statistical analysis conducted on geographies consisting of 237,789,521 people shows a moderate positive correlation between the proportion of Immigrants from Netherlands and labor force participation rate among population between the ages 25 and 29 in the United States with a correlation coefficient (R) of 0.422 and weighted average of 85.1%. Similarly, the statistical analysis conducted on geographies consisting of 59,193,680 people shows a poor negative correlation between the proportion of Crow and labor force participation rate among population between the ages 25 and 29 in the United States with a correlation coefficient (R) of -0.133 and weighted average of 78.6%, a difference of 8.3%.
In Labor Force | Age 25-29 Correlation Summary
| Measurement | Immigrants from Netherlands | Crow |
| Minimum | 66.3% | 42.7% |
| Maximum | 100.0% | 100.0% |
| Range | 33.7% | 57.3% |
| Mean | 90.4% | 75.9% |
| Median | 88.8% | 77.3% |
| Interquartile 25% (IQ1) | 84.4% | 66.2% |
| Interquartile 75% (IQ3) | 100.0% | 83.9% |
| Interquartile Range (IQR) | 15.6% | 17.6% |
| Standard Deviation (Sample) | 8.9% | 15.3% |
| Standard Deviation (Population) | 8.8% | 15.1% |
Similar Demographics by In Labor Force | Age 25-29
Demographics Similar to Immigrants from Netherlands by In Labor Force | Age 25-29
In terms of in labor force | age 25-29, the demographic groups most similar to Immigrants from Netherlands are Immigrants from Romania (85.1%, a difference of 0.0%), Immigrants from Korea (85.1%, a difference of 0.010%), Immigrants from Sudan (85.1%, a difference of 0.010%), Mongolian (85.1%, a difference of 0.020%), and Bangladeshi (85.1%, a difference of 0.020%).
| Demographics | Rating | Rank | In Labor Force | Age 25-29 |
| Immigrants | Croatia | 96.4 /100 | #88 | Exceptional 85.2% |
| Immigrants | France | 96.3 /100 | #89 | Exceptional 85.2% |
| Burmese | 95.9 /100 | #90 | Exceptional 85.1% |
| Immigrants | Moldova | 95.8 /100 | #91 | Exceptional 85.1% |
| Immigrants | Costa Rica | 95.5 /100 | #92 | Exceptional 85.1% |
| Austrians | 95.3 /100 | #93 | Exceptional 85.1% |
| Immigrants | Korea | 94.8 /100 | #94 | Exceptional 85.1% |
| Immigrants | Netherlands | 94.6 /100 | #95 | Exceptional 85.1% |
| Immigrants | Romania | 94.6 /100 | #96 | Exceptional 85.1% |
| Immigrants | Sudan | 94.3 /100 | #97 | Exceptional 85.1% |
| Mongolians | 94.1 /100 | #98 | Exceptional 85.1% |
| Bangladeshis | 94.0 /100 | #99 | Exceptional 85.1% |
| Immigrants | Switzerland | 93.9 /100 | #100 | Exceptional 85.1% |
| Egyptians | 93.8 /100 | #101 | Exceptional 85.1% |
| Slavs | 93.7 /100 | #102 | Exceptional 85.1% |
Demographics Similar to Crow by In Labor Force | Age 25-29
In terms of in labor force | age 25-29, the demographic groups most similar to Crow are Lumbee (78.3%, a difference of 0.37%), Immigrants from Yemen (78.2%, a difference of 0.49%), Paiute (78.1%, a difference of 0.65%), Apache (79.2%, a difference of 0.76%), and Native/Alaskan (79.3%, a difference of 0.83%).
| Demographics | Rating | Rank | In Labor Force | Age 25-29 |
| Puerto Ricans | 0.0 /100 | #330 | Tragic 80.4% |
| Cheyenne | 0.0 /100 | #331 | Tragic 80.3% |
| Inupiat | 0.0 /100 | #332 | Tragic 79.8% |
| Sioux | 0.0 /100 | #333 | Tragic 79.7% |
| Yuman | 0.0 /100 | #334 | Tragic 79.3% |
| Natives/Alaskans | 0.0 /100 | #335 | Tragic 79.3% |
| Apache | 0.0 /100 | #336 | Tragic 79.2% |
| Crow | 0.0 /100 | #337 | Tragic 78.6% |
| Lumbee | 0.0 /100 | #338 | Tragic 78.3% |
| Immigrants | Yemen | 0.0 /100 | #339 | Tragic 78.2% |
| Paiute | 0.0 /100 | #340 | Tragic 78.1% |
| Tohono O'odham | 0.0 /100 | #341 | Tragic 77.5% |
| Pueblo | 0.0 /100 | #342 | Tragic 77.5% |
| Arapaho | 0.0 /100 | #343 | Tragic 76.6% |
| Hopi | 0.0 /100 | #344 | Tragic 76.5% |